
Ether has not expanded since the SEC approved Ethereum ETFs on Thursday, March 23. Before Bitcoin’s price could go on a tremendous bull run and hit an all-time high of $73,738.00 on March 14, it took over a month for the ETF approval.
Ethereum switched to proof of stake (PoS) in September 2022 as part of a series of related updates that increased the platform’s sustainability and security. Proof of stake replaces miners with validators, who stake their bitcoin holdings to activate the capacity to generate new blocks, and replaces processing power with staking, which uses less energy.
Diversifying portfolios is encouraged by the rising popularity of Ether dApps among traders. A closer examination of the link between BTC and ETH may indicate that the price of Ethereum is about to rise.
BTC/ETH correlation coefficient
The price relationship between Bitcoin (BTC) and Ethereum (ETH), usually represented in terms of BTC, is referred to as the BTC/ETH correlation. For instance, if Ethereum is valued at $3,000 and Bitcoin at $60,000, the ratio is 0.05, suggesting that 0.05 BTC is needed to purchase one ETH. The ratio rises if ETH’s price grows more quickly than BTC’s, meaning more BTC are needed to purchase ETH.
The correlation coefficient, which ranges from -1 to 1, is an additional metric for describing this connection. A correlation value of 1 denotes a positive movement of BTC and ETH, a correlation coefficient of -1 denotes a negative movement, and a coefficient of 0 denotes no association at all. For example, in times of negative correlation, the price of ETH would decrease and vice versa if the price of BTC increased.
The price link between the two assets is therefore shown by the BTC/ETH correlation, whilst the correlation coefficient quantifies the movement of their values in regard to one another. To trade the BTC/ETH correlation effectively, both indicators are essential.
Historic correlation
According to historical evidence, bull markets often see greater prices for Ethereum. For example, in the bull markets of 2018 and 2021, the price of ETH was more than 0.05 BTC. The 0.05 BTC level has continuously functioned as a reliable support zone after 2021. On the other hand, there have been three instances where the 0.08 BTC level has served as notable resistance.
The correlation has been rising rapidly during the Bitcoin bull run and peaked on March 14 when the price of BTC hit its all-time high.
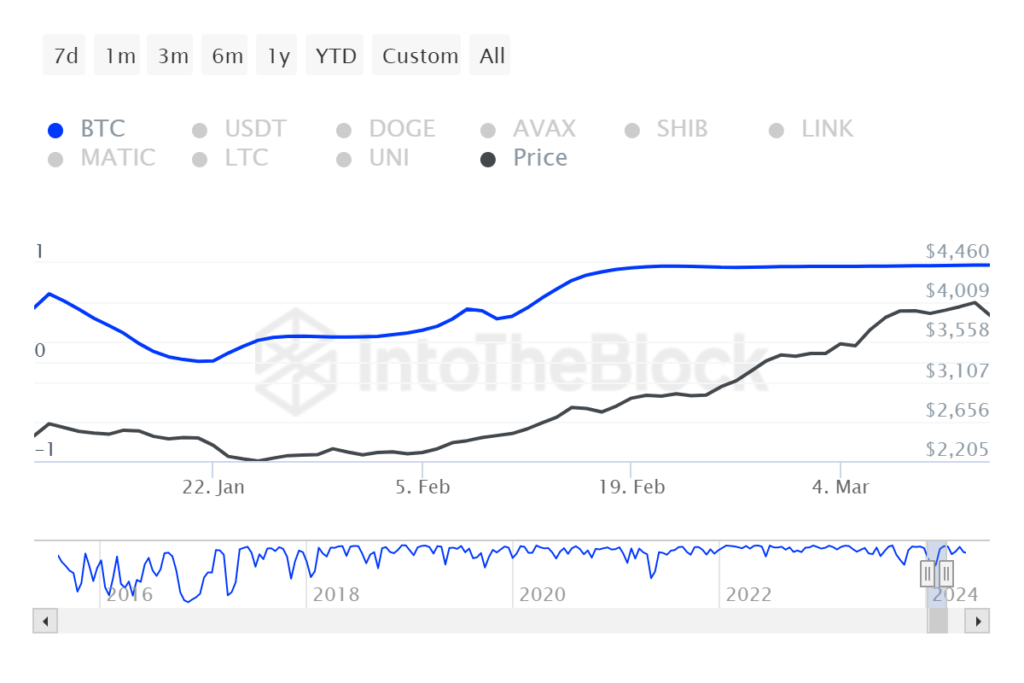
According to the graph, Ethereum performs better in bull markets than Bitcoin and worse in down markets. Even though previous performance can not guarantee future outcomes, it can offer insightful information to help make better decisions.
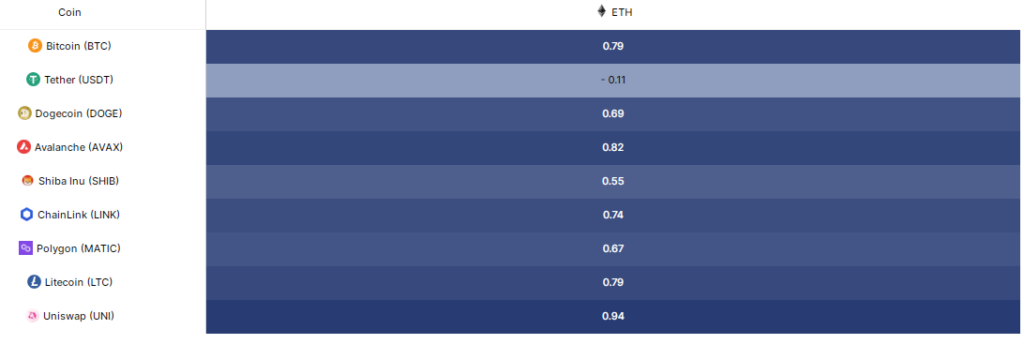
The connection between Bitcoin (BTC) and Ethereum (ETH) has been decreasing since early 2023, according to a new Coinbase analysis. This decline was most noticeable following Ethereum’s April 12 Shanghai (Shapella) hard fork, which made staked ether withdrawals possible. The 40-day rolling correlation dropped from 0.95 to 0.82 as a result of this modification.
Although BTC and ETH have historically moved in tandem, the divergence is being caused by a number of causes, including the growing acceptance of decentralised apps (dApps) built on Ethereum, the appeal of non-fungible tokens (NFTs), and Ethereum’s transition to a proof-of-stake (PoS) consensus mechanism.
Ethereum ETFs expectations
95% of current ETH investments are lucrative, according to IntoTheBlock’s study, and the price of ETH has increased by 30% in the last seven days. Since ETH prices reached an all-time high in November 2021, this level of profitability has not been seen.
The amount of ETH bought at prices greater than the current ones faces little opposition. In particular, 53.54 million ETH were acquired between $2,160 and $2,650, and 3.57 million ETH were purchased between $3,800 and $4,800.
ETH whales have also started to make big swings in response to the improved chances of ETF approval. ETH’s on-chain trade volume reached a record high of $15.98 billion on Tuesday, the 21st, the biggest since June 13, 2022.
Out of the $15.98 billion in documented trading activity, transactions surpassing $100,000—typically carried out by whales—accounted for $14.33 billion of the total. This amounts to 90% of the whole volume transacted on this particular day. Given that the ETFs have been approved, it is reasonable to anticipate an acceleration of this trend.
An important turning point in the acceptability of cryptocurrencies has been reached with the approval of the ETH ETFs, which has probably encouraged more activity among ETH whales as seen by the recent spike in high-volume transactions. Significant on-chain trade volumes, which highlight the changing environment, point to increased investor and institutional trust in Ethereum.


