One of the most erratic assets on the bitcoin market is most likely Shiba Inus. The price fluctuations of SHIB have been particularly noteworthy lately since, according on the most recent chart patterns, it is moving on a level. At present, the token is at a critical juncture, situated at the base of a symmetric triangular pattern that has developed over the course of several weeks.
Generally speaking, a symmetrical triangle is considered a continuation pattern, meaning that after the consolidation it symbolises, it may break out in any direction. This pattern for SHIB has been defined by higher lows and lower highs that eventually converge to a position that signals an impending large price move. The uncertainty around the possible breakthrough is increased by the fact that the trading volume during this time has not revealed a clear trend.
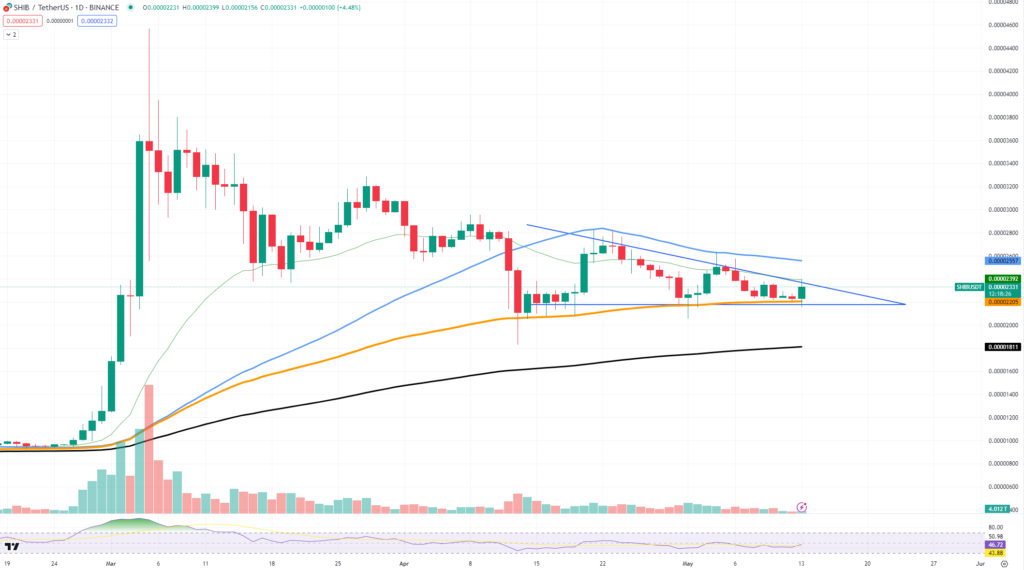
The price of SHIB has come into contact with the bottom support boundary of the triangle throughout the last day. For traders and investors, this is a critical time since a stay above this level might indicate strength and possibly an upside reversal.
On the other hand, a break below would indicate that the current negative trend will continue. Another important area is the triangle’s top boundary. A strong close above this resistance level may signal that bulls have gained the upper hand and signal a breakout to higher price levels.
Considering the unpredictable nature of SHIB, it is important to take into account both possible outcomes. Breaking above the upper barrier might lead to a significant higher surge, capitalising on the present consolidation, if traders and investors can generate another push. If there isn’t any momentum, SHIB may keep testing lower levels and eventually break out of the triangle, which would be bad for the short-term price direction.


