
The recent dramatic decrease in the value of XRP cryptocurrency attracted the attention of both traders and investors. XRP has had a fall following a stretch of significant increases, raising questions about its future course.
According to the XRP chart’s technical analysis, there has been a substantial sell-off in the asset, with the price falling sharply in a little amount of time. As a result of this severe drop, XRP is testing important support levels that may indicate the short-term trend of the asset.
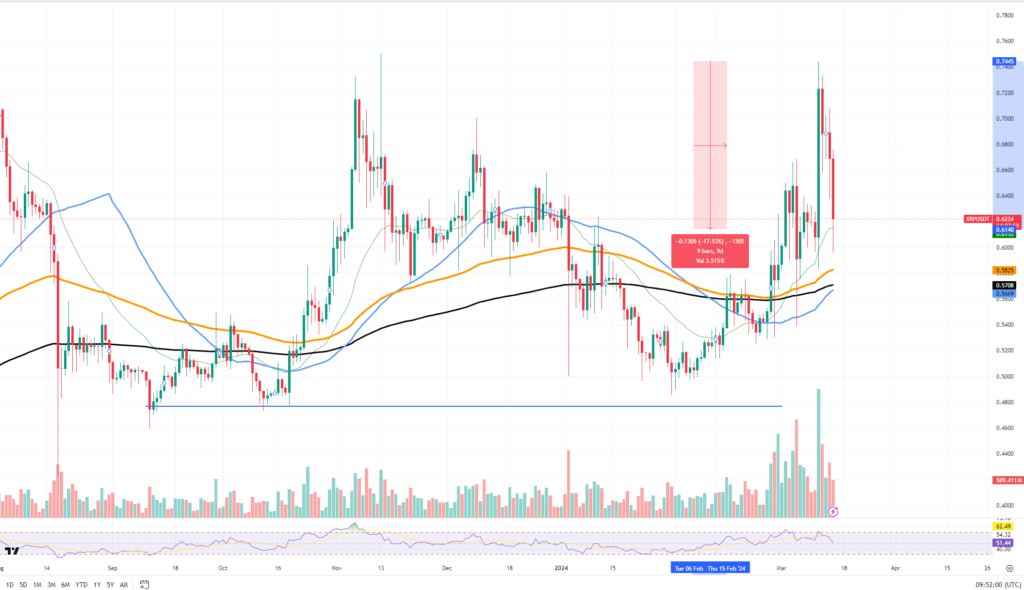
XRP is presently trading at a crucial local support level of $0.58, which corresponds to the 100-day moving average. A rebound off of this moving average, which has historically served as a strong support level, may indicate the beginning of a phase of consolidation or recovery. If this support holds, it may offer XRP’s price a base upon which to stabilise and possibly even rise.
On the other hand, resistance levels have developed at higher prices, especially above $0.74, where XRP found it difficult to sustain its upward momentum. In order to resume a bullish trend, XRP would need to clear this resistance level, which stands for a substantial obstacle.
During the sell-off, the volume indicator spikes, suggesting a robust market response and maybe the peak of selling pressure. This may indicate that the market is getting rid of its weak players and is getting close to burnout.
In addition, the relative strength index (RSI) has entered oversold zone, which generally indicates that the asset has been oversold and may indicate a possible reversal if market mood changes. The present position of the relative strength index (RSI), a momentum oscillator that gauges the speed and variation of price moves, may suggest that the selling momentum is overextended.


