
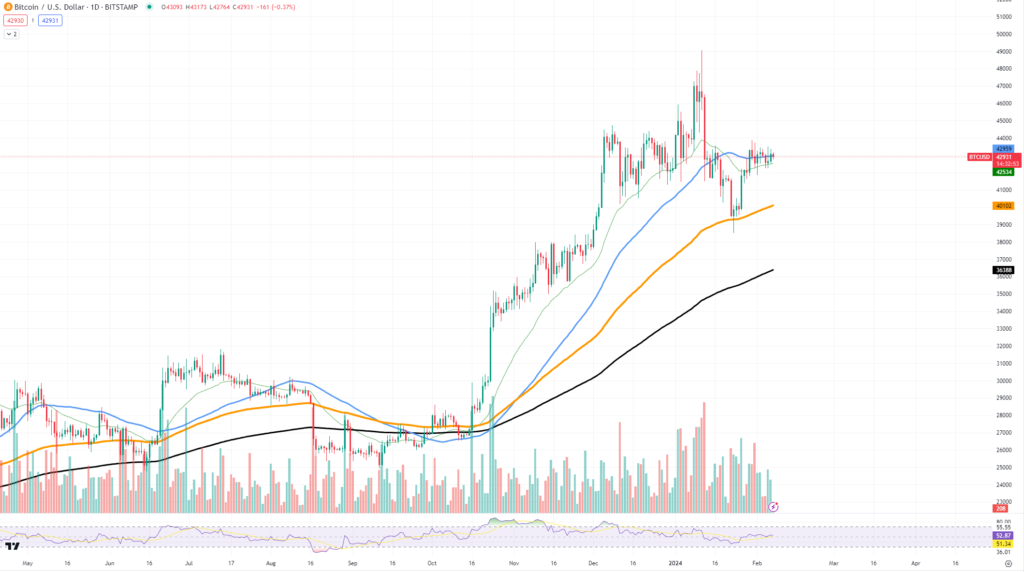
While history does not repeat itself, it does rhyme frequently. Peter Brandt, a legendary trader, believes another parabolic Bitcoin run is about to happen. The charts, with all of their highs and lows, depict a picture that has historical resonance.
Elliott Wave Theory, which asserts that markets move in predictable, wave-like patterns, is an approach that Brandt’s analysis uses. Investor psychology, which frequently manifests as a series of waves with peaks and troughs, drives these patterns. Recent charts by Brandt seem to follow similar wave-like patterns, suggesting that the value of Bitcoin may see a parabolic rise.
The charts show a logical pattern with the whimsically unconventional labels bump, hump, slump, pump, and dump. This series follows the Elliott Wave theory of market cycles. Not only does the pattern name need to be taken seriously, but this formation’s repetition has historically preceded noteworthy market changes.
The “bump” stage in the shown charts denotes a strong bullish momentum, while the “hump” stage denotes a period of consolidation. Often, the ensuing “slump” results in a crucial “pump,” which may act as a trigger for exponential development. The last phase, or “dump,” acts as a reminder of the volatility of the market and its ultimate return to balance.
The predicted parabolic growth trajectory for Bitcoin might materialise if it retains support and breaks over significant resistance levels. On the other hand, should these supports collapse, Bitcoin may retreat and postpone its projected increase.
If Brandt’s idea comes to pass, only time and the collective psychology of investors will tell. Following the most recent Solana outage, which rocked the altcoin and cryptocurrency markets overall, the cryptocurrency world is now still getting over it.


