
The sixth-largest cryptocurrency by market capitalization, XRP, is getting close to a turning point as a significant chart pattern approaches.
It is predicted that in the next days, XRP’s daily simple moving averages (SMA) will cross, producing either a golden or death cross.
If the daily 50-day SMA for the cryptocurrency is not invalidated, it appears that it will go below the 200-day SMA, which might lead to a bearish death cross.
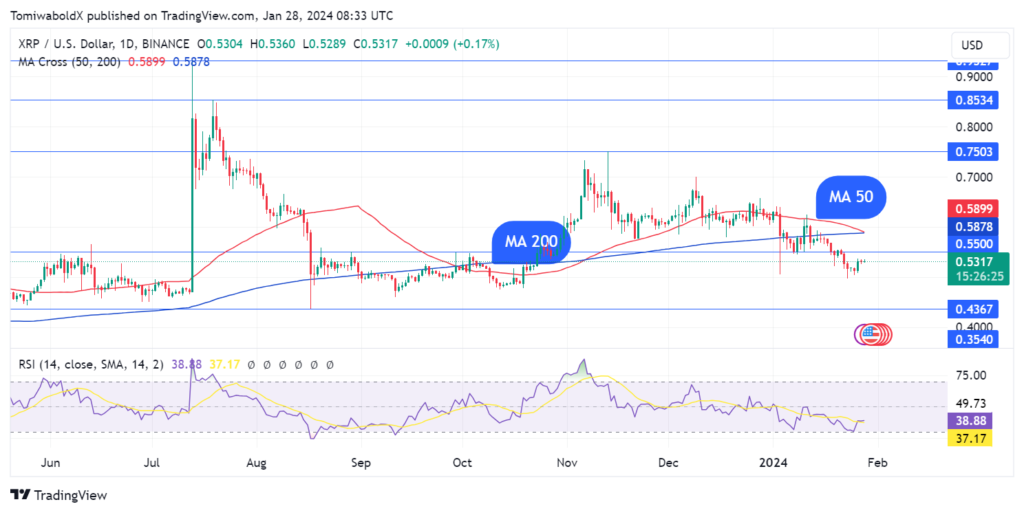
Another possibility is that the 200-day SMA is surpassed by the 50-day SMA, leading to a golden crossover. On the other hand, the SMA crossing’s characteristics could suggest whether it’s a golden or death cross.
Following the latest market meltdown, which saw XRP fall to a three-month low of $0.496 on January 23, the cryptocurrency has been battling to rebound. Since then, the price has returned to around $0.56, although it is still below the 200-day SMA ($0.587) and the 50-day SMA ($0.589), which serve as important resistance levels.
However, past performance suggests that a moving average crossover may not be a trustworthy indication on its own. In the past, XRP death crosses have frequently indicated the cryptocurrency’s big or intermediate bottoms.
In September of last year, XRP formed a death cross on its charts, which caused it to bottom around $0.483. Less than two months later, in November, it reached highs of $0.75.
Likely scenarios
One scenario in which XRP may experience a death cross is a temporary dip, unless it reaches a bottom before it starts to rise again.
Should this come to pass and a break of the moving averages is accomplished, XRP may aim for the next resistance levels, which are located at $0.70 and $0.75. A bounce towards $1 would be possible if there was a break above $0.75, which would validate a positive turnaround.
However, if a death cross appears and prompts more selling in the XRP market, the next levels of support to keep an eye on are $0.483 and $0.476, since these have recently served as potent demand areas. A decline below $0.40 would expose the price to the $0.42 barrier, which hasn’t been touched since August 2023, and would validate a bearish trend.
Moving average crossings, as previously said, may not be a trustworthy indication of price changes on their own, therefore traders would be better off paying attention to the attitude of the XRPL ecosystem as a whole as well as the general state of the market.


