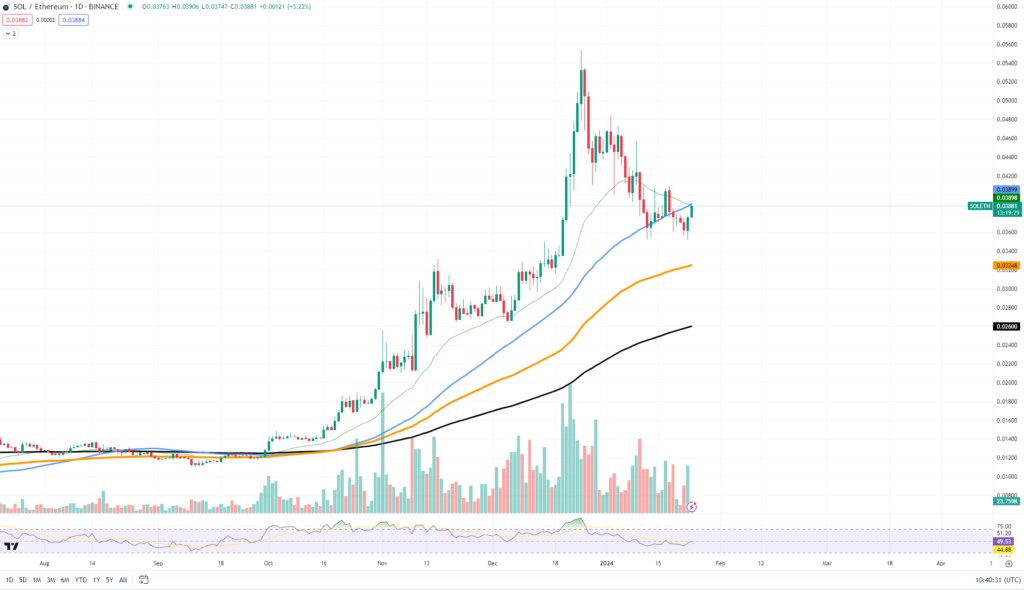
Investors who want to explore beyond the typical USD pairing can get an interesting point of view from the Solana/Ethereum price chart. Examining the SOL/ETH chart in detail is crucial in order to identify local levels of support and resistance as well as to comprehend the ramifications of Solana’s performance in comparison to Ethereum, which is its primary rival.
The SOL/ETH chart serves as a benchmark for internetwork rivalry and financial flows between two large ecosystems, however it is frequently eclipsed by its USD counterpart. Investors may monitor the relative investment attractiveness and technological progress of each blockchain by comparing Solana’s value in relation to Ethereum.

Solana is now exhibiting indications of a possible breakout versus Ethereum, which may portend an impending boom in the meme currency market, DeFi operations, and other applications focused on Solana. An increase in SOL relative to ETH suggests that investors are becoming more confident in Solana’s infrastructure and may be looking ahead to events in the market or new initiatives.
On the other hand, a decline in Solana’s value relative to Ethereum indicates that money is shifting in favour of the more established network, which is good for ETH. Investors looking to assess these platforms’ development and recovery trajectory must pay close attention to these patterns.
Looking at the SOL/USDT chart, we can see particular price points that serve as support and resistance markers. Resistance levels show the potential stopping points of an uptrend brought on by selling pressure, while support levels show the price areas where a downturn pauses because of a concentration of demand.
Solana has demonstrated resiliency at a support level of about $88.65 as of this writing, indicating a significant buying presence at current pricing. Resistance on the upside is seen close to the $92.31 level, which has traditionally seen sellers enter the market.


