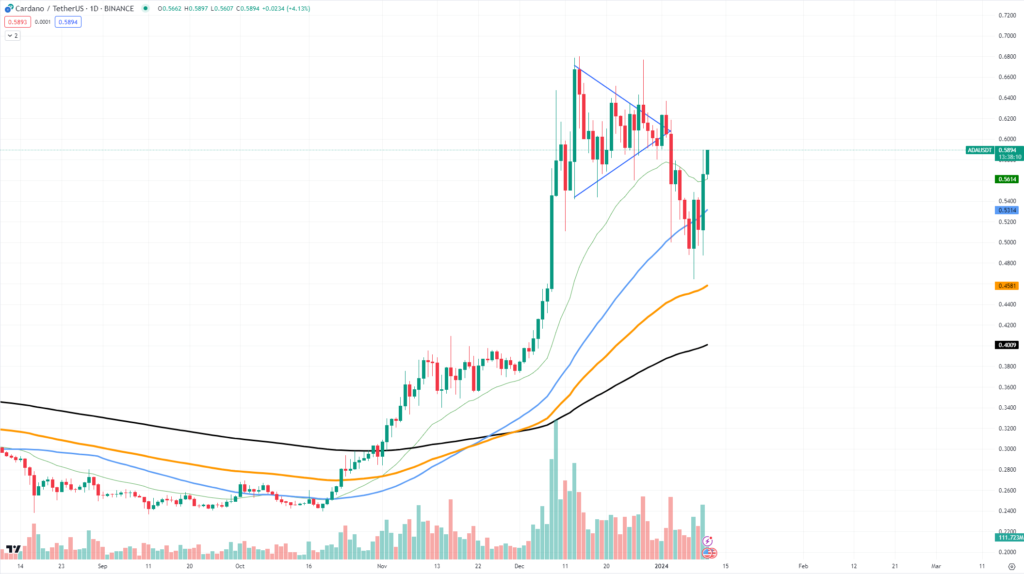
Cardano and the other top ten crypto assets are leading the market right now. Between ADA and its next possible bullish phase, the $0.6 level acts as a barrier, and current market dynamics indicate a breach may be approaching.
A thorough examination of Cardano’s price chart reveals a steady rise towards this crucial level, accompanied by progressively stronger support and resistance. As of right now, $0.58 is the first local resistance level that ADA must overcome. This is the price at which selling pressure has traditionally concentrated. If ADA exceeds this, it will probably come up against its next test at $0.6, which if broken may indicate an improvement in investor attitude and possibly an upswing.

Support levels are also significant; previous price rallies have been built around the $0.55 mark. But what gives ADA’s chart a hint of optimism is the 26-day Exponential Moving Average’s (EMA) breakout. Technical indicators like this crossing frequently signal bullish price momentum and indicate that buyers are gaining the upper hand over sellers.
It is not entirely possible to credit Cardano’s recent price performance to changes inside its own ecosystem, despite these technical markers. Nothing significant has been announced or updated that would usually trigger such a rise. Instead, the upward momentum we are observing with ADA looks to be riding the coattails of the greater marketwide rise, prompted by the approval of the spot Bitcoin ETF.
Investors should take note of this background since it suggests that the durability of Cardano’s price gain could not be independent of the mood of the market as a whole. It seems doubtful that Cardano’s advantages alone will sustain the surge in the absence of significant ecosystem developments.
Holders of ADAs ought to monitor their resistance levels. A decisive breach above $0.6 can spark a positive sentiment and result in more gains. On the other hand, if momentum wanes, Cardano may pull back to levels of consolidation support that are stronger.


