There seems to be a turning point for the Shiba Inu (SHIB) token. On-chain data shows a notable change in the actions of the major participants in the bitcoin market, known as whales. Interestingly, Shiba Inu’s high transaction volume is starting to decline as the price is rising or moving into a consolidation phase. This trend implies that these whales cashing in on their investments caused the latest market sell-off.
The Shiba Inu chart tells a compelling narrative when examined in further detail. There is a discernible drop in volume following a period of increased activity, which is frequently linked to big holders, or “whales,” aggressively purchasing or selling. The price has stabilised and the volume has decreased, suggesting less sell pressure. The price fell dramatically during the sell-off, but it has since bounced back and is currently displaying indications of an uptrend or stabilisation.
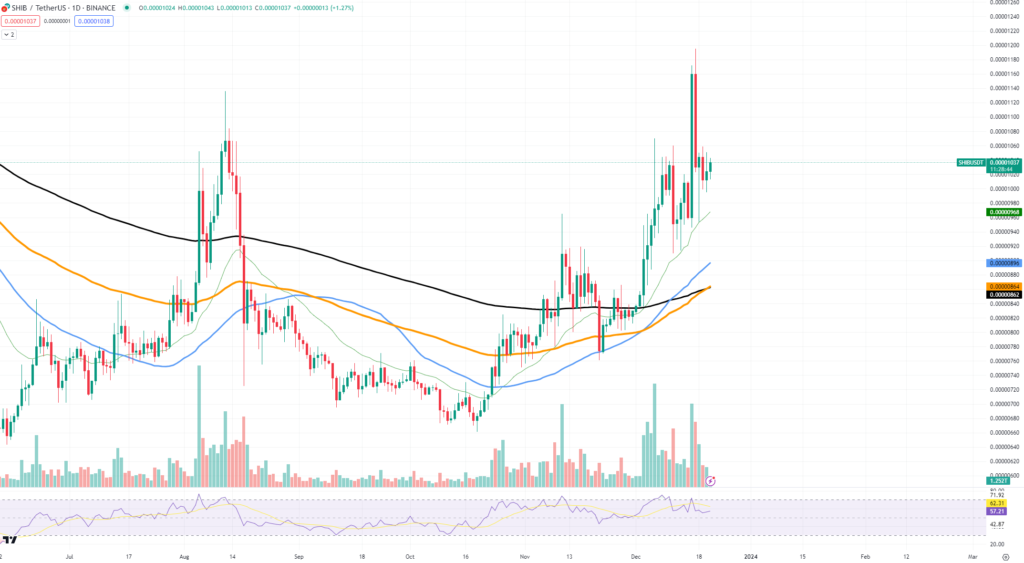
A bullish candlestick pattern on the chart suggests that the prior downturn may be about to reverse. The 50-day (orange), 100-day (blue), and 200-day (black) Moving Average (MA) lines are heading upward, which is typically seen as a bullish indicator. The 100-day and 200-day moving averages are below the 50-day MA, which supports the bullish outlook.
The Relative Strength Index (RSI), a different technical indicator that assesses overbought or oversold circumstances by calculating the size of recent price moves, is now in the 50–60 level. This level is often seen as a neutral zone, indicating that SHIB is neither now overbought or oversold.
Following whales’ profit-taking, price consolidation following a jump frequently signals that the market is coming to an agreement on a new token value. This is a critical stage where the token may meet opposition and perhaps even reverse its steps, or it may get ready for another leg up.


