
Rapid changes are common in the world of digital currencies, and XRP has historically been no exception. Recent chart analysis reveals a trend that has been highly popular with XRP investors and traders: the formation of a “death cross.”
When a short-term moving average—typically the 50-day moving average—crosses below its long-term counterpart—typically the 200-day moving average—this is known as a “death cross” and is a technical indication. Typically, this phenomena is viewed as a negative indicator, indicating probable downtrends. The given XRP chart clearly shows that this crucial moment has occurred, making it the first instance of its kind in 2023.
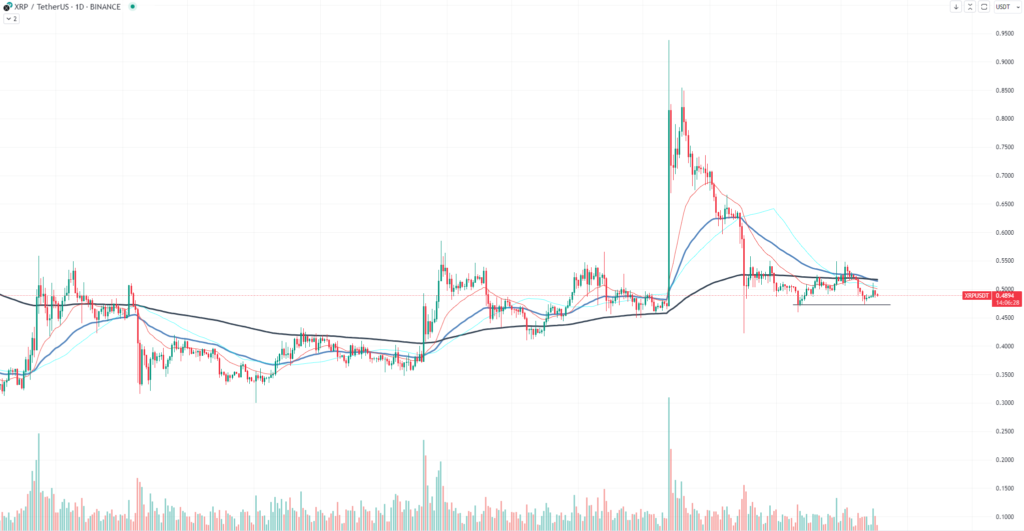
However, context is crucial for all indicators. The death cross’s dependability, especially when liquidity is limited, is a frequently disregarded component. Fewer market participants and lower trade volume are indicators of thin liquidity. When this happens, even little trades have a big impact on the price, which may make the death cross less reliable as a bearish warning. The current chart for XRP does indicate periods of lower trading activity, suggesting that liquidity may be scarce.
More significantly, it is crucial to compare technical patterns like the death cross to the larger context, even though they offer insightful information. The continuing legal battle between Ripple Labs and the Securities and Exchange Commission (SEC) of the United States dominates this context for XRP. The result of this case might have a significant impact on how XRP is regulated, how widely it is used, and ultimately how much it costs. This event will probably significantly overwhelm technical indications due to its size.
Given the limited liquidity and dominating impact of the Ripple-SEC case, it is possible that future XRP movements may be more influenced by legal developments than by transient technical trends. As usual, keep abreast of the Ripple-SEC proceedings and think carefully before making any investment choices.


