Numerous crypto traders and investors have become interested in Ethereum (ETH) because to its recent market behaviour and depreciation. The supply of ether has been increasing since December 2022. This Ethereum inflationary tendency has been caused by a number of variables. Notably, a higher daily issuance along with lower transaction costs have sped up the expansion of ETH’s supply.
The following graphical illustration contrasts Ethereum’s network activity with its deflationary tendency. This chart may be analysed to reveal some startling facts. The burn rate at this time is 402K ETH per year, showing that even while transactions are still being completed and fees are being paid, a sizable amount of Ether is still being lost or “burned” in order to maintain the present level of service.
The supply growth, on the other hand, indicates a rise of 0.36% over a 30-day period. Additionally, the issuance stands at 834K ETH year, underscoring the ecosystem’s expanding production of fresh Ether.
It is important to remember that Ethereum’s net issuance currently remains at a meagre 0.44% yearly, despite the fact that these variables are driving Ethereum in the direction of inflation. Ethereum’s rate of inflation is still noticeably lower when compared to Bitcoin’s.
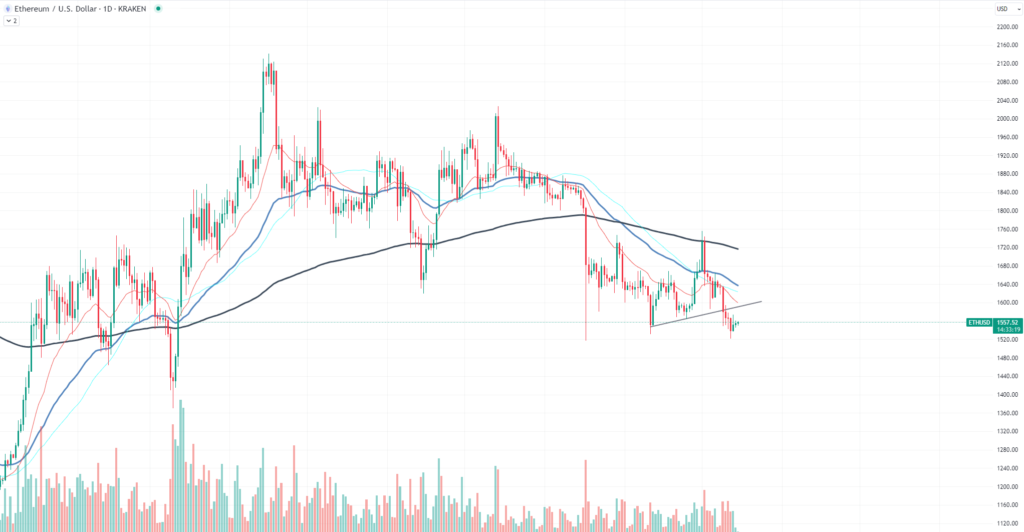
In terms of price, Ethereum has recently encountered some difficulties. A decline in the price of the cryptocurrency below the $1,600 level has traders and investors worried. With its present course, Ethereum’s price is edging closer to the important $1,400 support level, which in the past has been significant as a point of trend reversal in March.
Right present, downward pressure may be seen in Ethereum’s price movement. Despite displaying some resistance at the $1,575 region, the ongoing testing of this support points to a likely failure. If ETH cannot sustain this posture, it may eventually travel in the direction of the $1,400 level.


