
The Shiba Inu (SHIB) coin has recently attracted interest due to its meme status as well as a technical pattern called a symmetrical triangle that is building on the price chart. This pattern is sometimes seen as a continuation pattern, which denotes that it typically predicts the direction the asset will go after a period of consolidation.
What is a symmetrical triangle?
A symmetrical triangle is a triangle-shaped chart pattern in which the price travels between two convergent trendlines. This pattern, which can manifest either upwards or downwards, is typically seen as a time of market uncertainty. The breakout direction frequently predicts the anticipated course of the price.
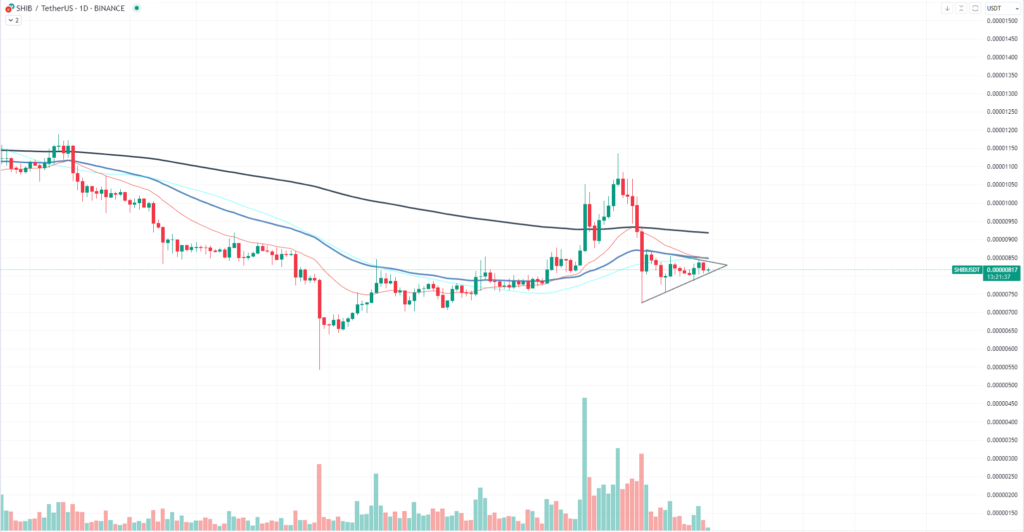
Shiba Inu is now selling at about $0.00000818 as per the most recent statistics. Traders are closely monitoring for a breakout as the asset has been trading inside the boundaries of a symmetrical triangle.
This symmetrical triangle may prove to be pivotal for Shiba Inu. Typically, the pattern predicts that the asset will keep moving in the same direction as it was before entering the triangle. Shiba Inu has recently performed inconsistently, so a breakthrough might indicate a significant shift in either way.
Burn rate surges by 150%
The recent 150% increase in the Shiba Inu token burn rate is stoking the speculative fire. An asset becomes more rare with a greater burn rate, which may increase demand and lead to a price increase. This could serve as a trigger for SHIB as it gets closer to the point where its symmetrical triangle ends.
The symmetrical triangle offers traders a framework for probable outcomes, even if it is not a certain predictor of future price action. A bullish breakout is possible given the state of the market at the moment and the increase in burn rate.


