
It was tough year for Shiba Inu, but it might bring us some pleasant surprises in January
The Shiba Inu recently set a new local record as its volatility dropped to its lowest level in three months. Fortunately, an extremely low volatility period is usually a sign of an upcoming reversal or volatility spike, and the pattern we are seeing on the charts today may be a confirmation of this thesis.
Pattern
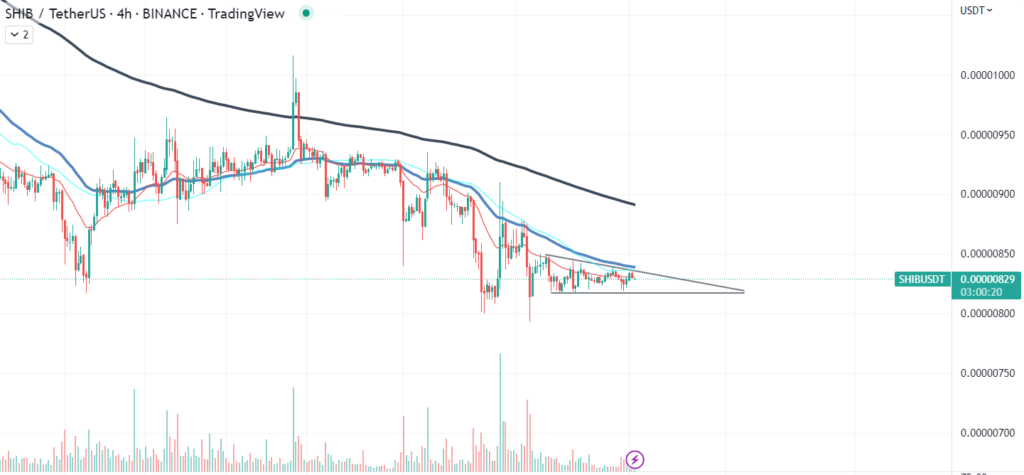
If we take a look at the intraday chart of the token, we can clearly see a descending triangle pattern formation, which has been confirmed by the ascending volume profile. By getting closer to the end of the formation, trading volume should rise significantly, causing an expected volatility spike.
Unfortunately, the technical status of the coin is not the only thing that investors and traders are watching. Macro factors such as the demand and flow of risk in the industry also have a significant impact on assets such as Shiba Inu or Dogecoin.
However, the formation of the aforementioned pattern could become a great foundation for a potential reversal. On the daily chart of the token, we will not be able to see the triangle as the only observable thing on that timeframe is the direct and narrow price rangebound.
Look back
Sadly, the end of 2021 and the beginning of 2022 haven’t given us any insight into SHIB’s possible moves in the new year. The property was in a completely different state in December of last year and was in the process of being reversed.
At press time, Shiba Inu is trading at $0.000008, and its next target would be a return above the $0.00001 price level, which has been acting as an important threshold for the asset’s stability.


