
Ethereum extended its increase above the $1,720 level against the US Dollar. ETH is now consolidating above the key $1,670 support zone.
- Ethereum remained in a positive zone but struggled near the $1,785 resistance area.
- The price is now trading above $1,650 and the 100 hourly simple moving average.
- There was a break below a major bullish trend line with support near $1,710 on the hourly chart of ETH/USD (data feed via Kraken).
- If it closes below $1,670 and $1,650 the pair can start a downside correction.
Ethereum Price Holds Key Support
Ethereum remained in a positive zone above the $1,600 level. ETH even extended its increase above the $1,670 and $1,700 levels.
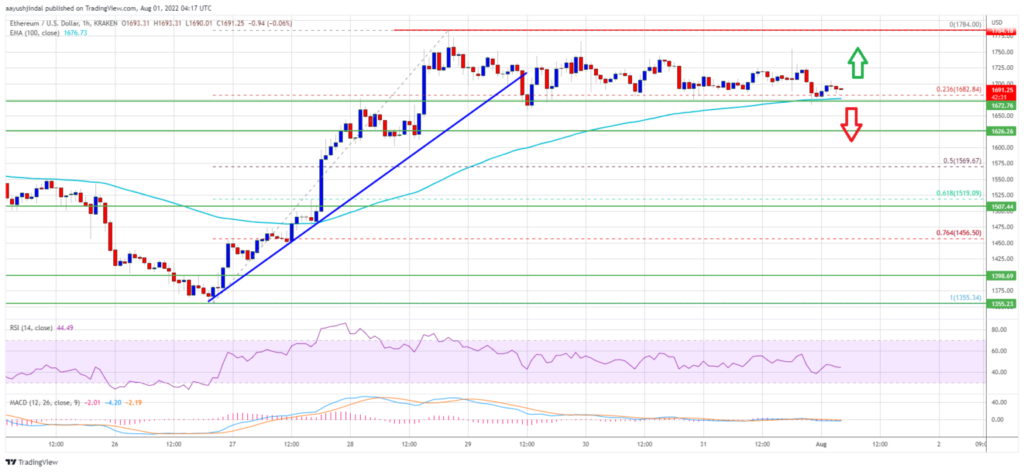
It climbed above $1,750, but did not move to $1,800. A high was formed near $1,784 and the price started a decline. There was a minor move below the $1,730 and $1,720 levels. Ether moved higher from the 23.6% Fib retracement level of the upward move from $1,355 low to $1,784 high.
Besides, there was a break below a key bullish trend line with support near $1,710 on the hourly chart of ETH/USD. The price is now trading above $1,650 and the 100 hourly simple moving average.
It is also consolidating above the 100 hourly simple moving average. An immediate upside resistance is near the $1,720 level. The first major resistance is near the $1,750 area.
The main resistance is now forming near the $1,785 zone. A clear move above the $1,785 level could even pump the price to $1,850. In the stated case, the price may perhaps rise towards the $1,920 resistance zone.
Downside Break in ETH?
If Ethereum fails to rise above the $1,750 resistance, it could initiate a downside correction. On the downside, an initial support is near the $1,670 area and the 100 hourly SMA.
A clear move below the $1,670 support might spark a move towards the $1,625 level. The next major support is near the 50% Fib retracement level of the upward move from the $1,355 swing low to $1,784 high. Any more losses might even push the price to the $1,500 support.
technical indicators
hourly macd , The MACD for ETH/USD is now losing momentum in the bullish zone.
hourly rsi , The RSI for ETH/USD is now below the 50 level.
Key Support Level – $1,670
Key Resistance Level – $1,750


