Numerous indicators suggest that coin is in process of reversal after months of beartrend
XRP’s price performance mostly mirrored the movement of large caps like Bitcoin and Ethereum, as it lost more than 40% of its value in the past month. The depressing performance also impacted the asset’s profitability, putting a large portion of investors at a loss. But according to technical indicators, the long-awaited bounce could be closer than it looks.
Bearish rally is fading
While volume is not the most popular tool for catching reversals on the market, it is still a good way to determine the power of the trend, as the fading volume may reflect the unwillingness or inability of traders to keep up the current flow on the market.
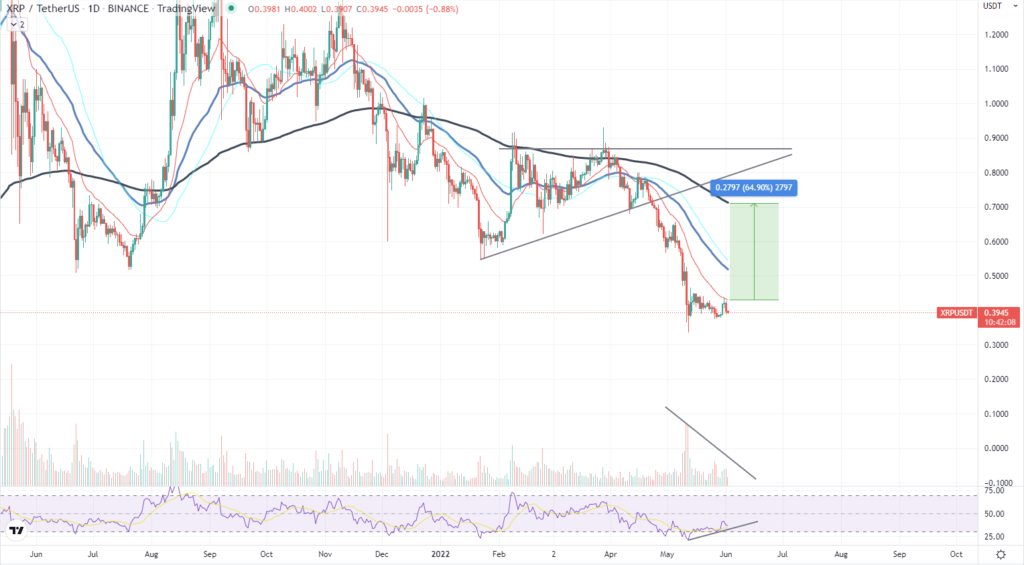
As the volume profile on XRP suggests, the downtrend is no longer fueled at the pace it was before. At the end of April, the bears were showing more activity as volume was up, unlike at the end of May.
Moving averages are moving apart
While the placing of moving averages on a chart cannot give signals about the continuation nor reversal of a rally, we are able to predict volatility spikes by looking at the range between short- and long-term lines.
With XRP, the moving averages are spaced apart, suggesting an upcoming volatility spike, which could be pointing upwards.
RSI is trending up
Besides the abovementioned indicators and signals, the reversal from the “oversold” zone of the RSI indicator is also a sign in favor of a reversal since the divergence between the chart and the indicator would suggest that a rally is dead before it started.
At press time, XRP has risen to $0.39 and lost 0.58% in the past 24 hours.


