Ethereum is about to end this week in the red. The bears were able to push the price down since nailing this week’s high at $3547. Currently, the daily MA-20 line acts as a solid support level, and the bulls struggle to hold it.
The daily chart
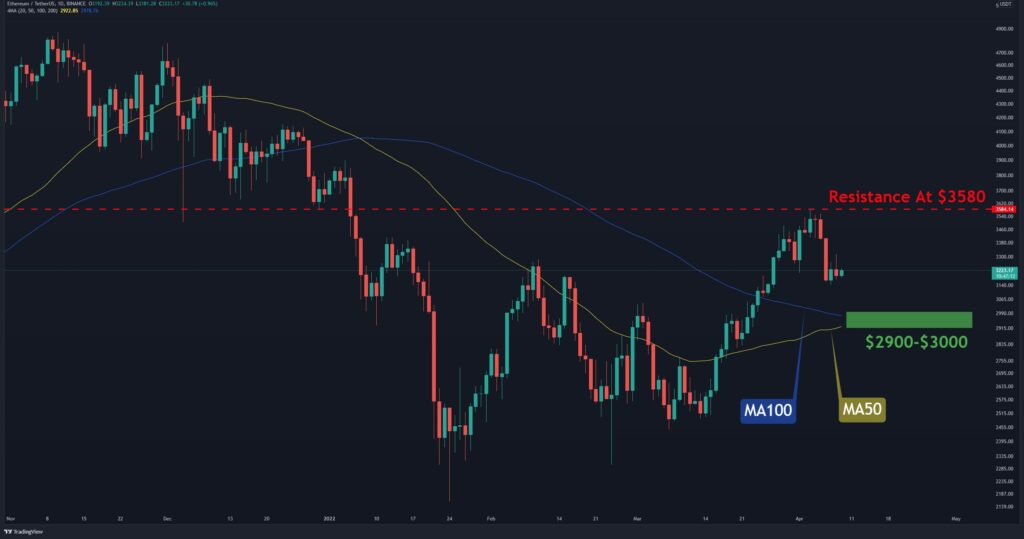
On the daily time frame, ETH fell towards the daily MA20 line (moving average) after the failure of the bulls at the important daily MA200.
Now the big question is whether the uptrend is over? To answer this question, it is necessary to determine the critical support and resistance levels.
As the following chart shows, the daily MA50 (marked in yellow) and the MA100 (marked in blue) are very close to each other, which can act as a strong psychological support level (marked in green) .
It is safe for the bulls as long as ETH is trading above this support. Conversely, correction is still possible if ETH does not reclaim above the resistance at $3580 or the daily MA200 line.
Moving average levels
MA20: $3255
MA50: $2,922
MA100: $2978
MA200: $3489
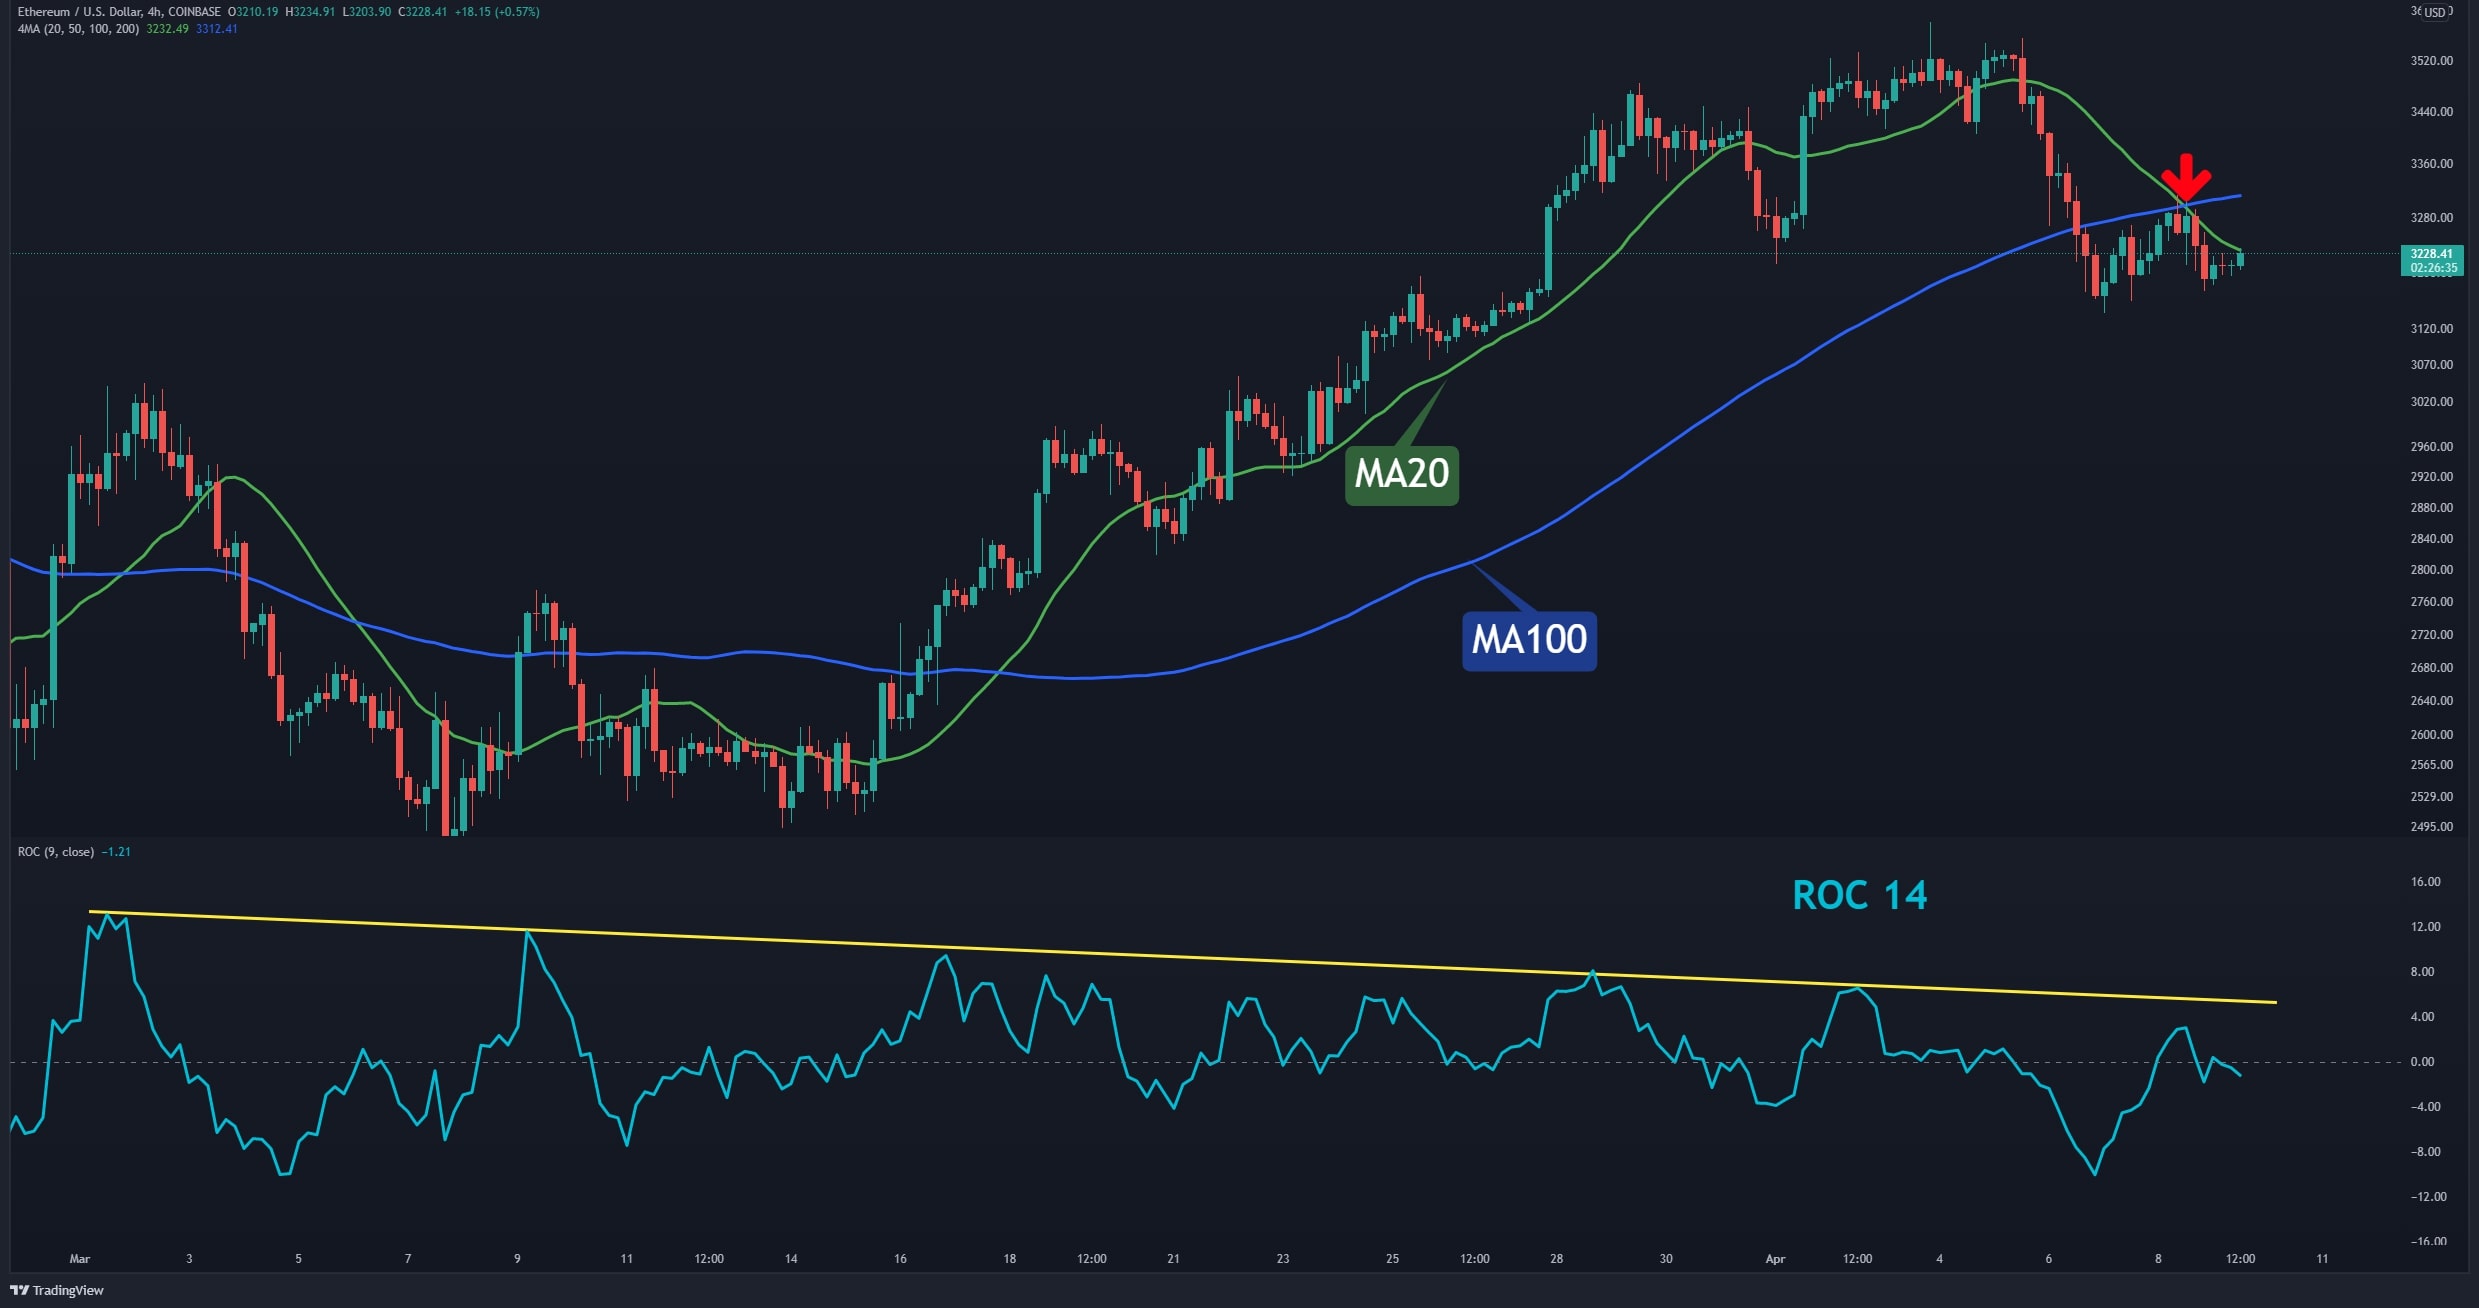
The 4-Hour Chart
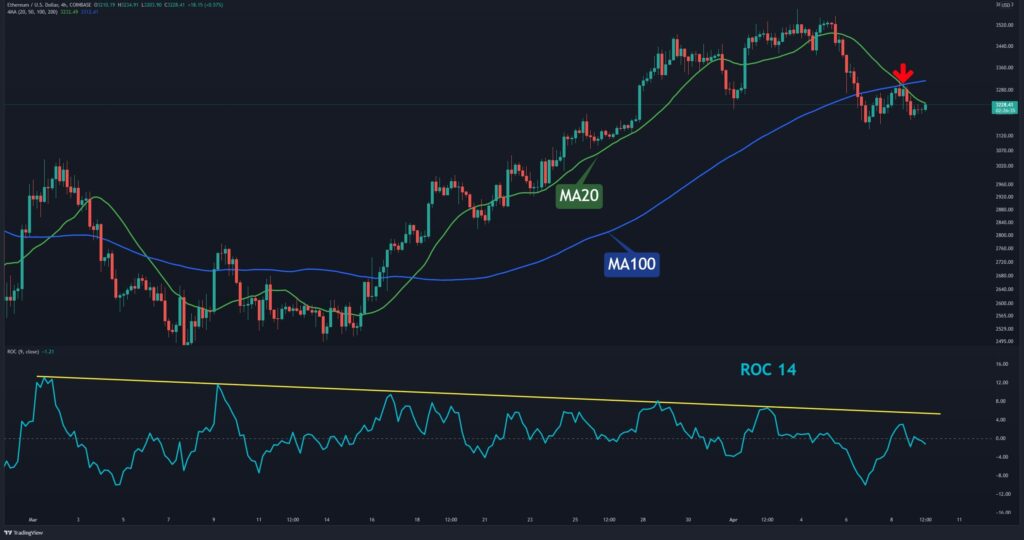
In the 4-hour timeframe, ETH is trading below the MA20 (marked green) and MA100 (marked blue) and has not been able to close a candlestick above them in the recent downtrend.
The ROC 14 indicator is also in the bearish zone, and if it moves towards the descending line (marked in yellow), ETH could see a short-term price increase.
At the moment, the most important for ETH is to reclaim the MA100 line to form a higher high, which is a strong bullish sign.
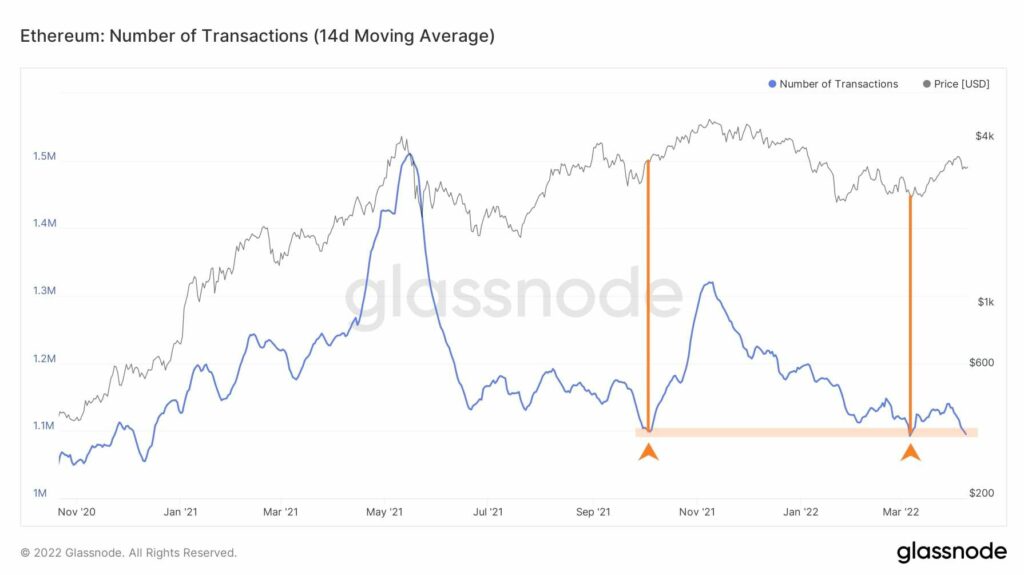
On-chain analysis: number of transactions (14-day moving average)
The total amount of transactions, while only successful transactions are counted.
When the price increases, the number of transactions can be expected to rise. Currently, this metric has reached a critical point.
In past events, after touching this level, an uptrend started. If this happens again and this metric starts rising with a steep slope, then based on this indicator, ETH can expect to aim above $4000.