
Bitcoin fell below the $39k area in the past few days as fears over inflation and invasion grew. In late January and early February, the short-term market structure flipped bullishly- but a crucial level of resistance was not tested as Ethereum slumped on the charts once more. A recent report highlighted how the perception that the Ethereum network’s powerhouse is the Defi sector could actually be inaccurate.
ETH- 12H
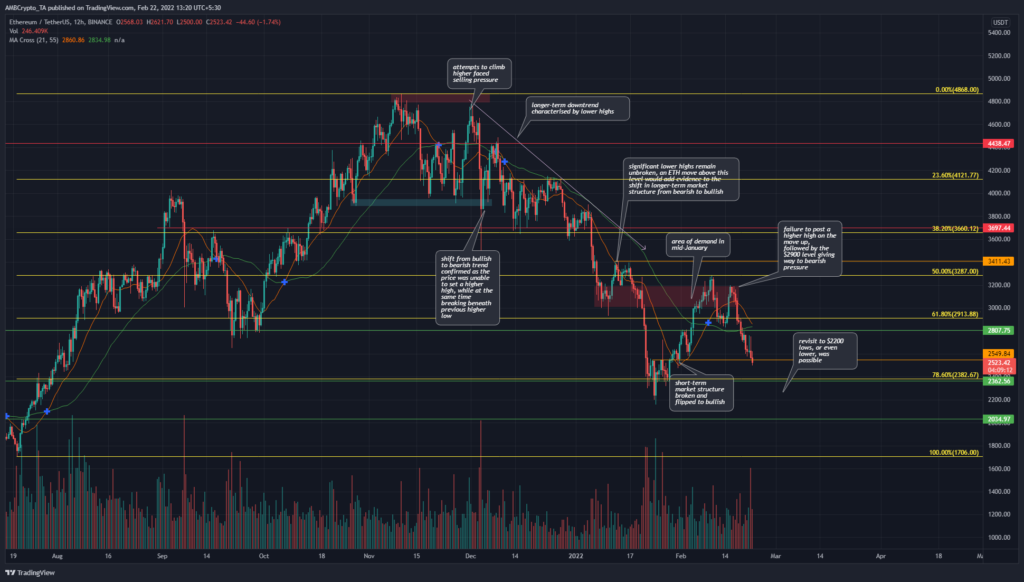
The short-term bullish bias in early February did not have enough strength to push the price past the $3200 area. The previous lower high was marked on the chart in orange at $3411 and the bears forced a rejection at the 50% Fibonacci retracement level. These retracement levels were plotted based on ETH’s move from $1706 to $4868.
Therefore, the longer-term market structure remained unbroken, with demand nowhere to be seen in recent days when the price crashed beneath the $2800 mark as well. This could see $2200, $2000, or even the $1700 levels revisited. At which point the 27.2% extension level south might come into the conversation.
However, USDT’s dominance (Tether dominance, its measure of market capitalization against the broader crypto market) stood at 4.79% – a value of 5.2% marked the lows respectively. of $29.4,000 and $1,700 for BTC and ETH.
Rationale
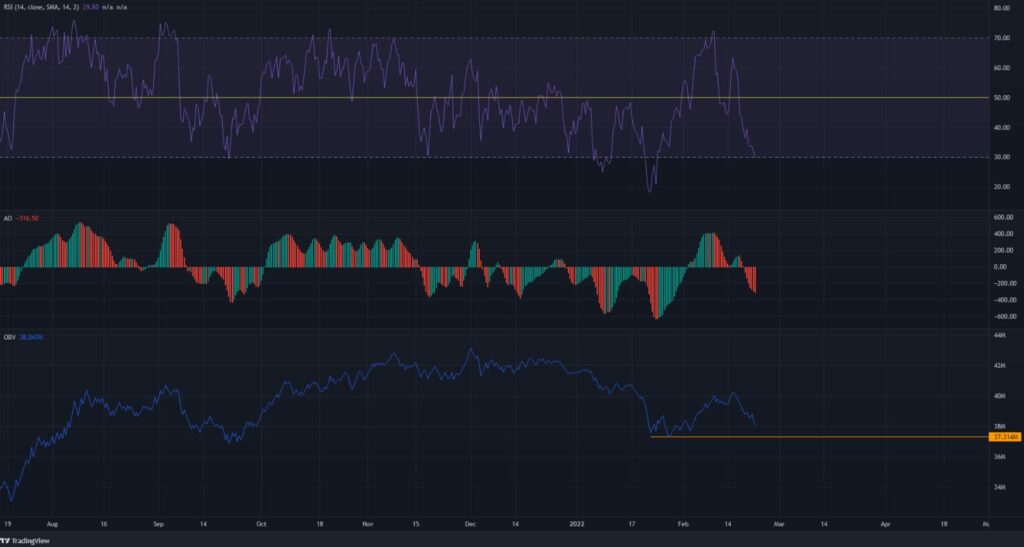
The RSI fell below neutral 50 once again on the 12-hour timeframe, in response to the selling pressure recently. A divergence was not spotted. The AO also fell below the zero line. Both momentum indicators have had a bearish leaning since early November, with only early February showing bullishness that was quickly expunged.
The OBV also saw a decline, and a level was marked on the indicator – a drop in the OBV below this level could see selling pressure intensify.
Conclusion
While there was a tiny indication that the bottom could be around the corner, the market structure and momentum remained bearish. It remains to be seen whether the $2362 level can hold as support, while a retest of the $2800-$2900 could be a selling opportunity.


