After a steady weekend, Bitcoin is holding the $42,000 range. Given options market strike prices and technical analysis, bitcoin is expected to fluctuate between $40,000 and $47,000 in the near term. Data from Onchain shows that long-time holders have eased their selling pressure recently, and it looks like BTC is consolidating.
Options Market Analysis
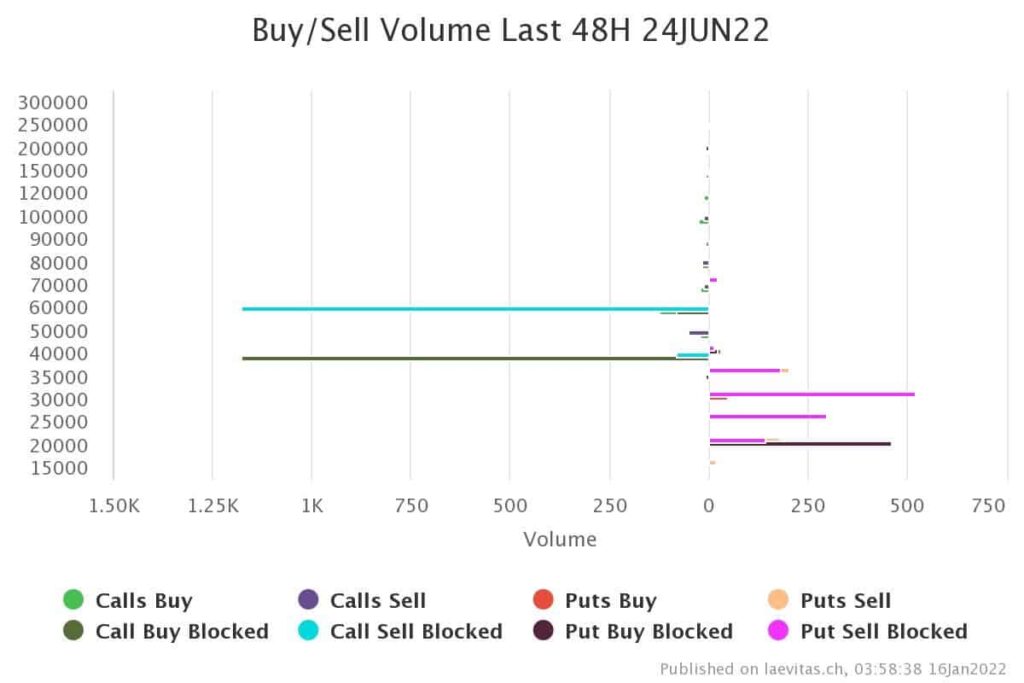
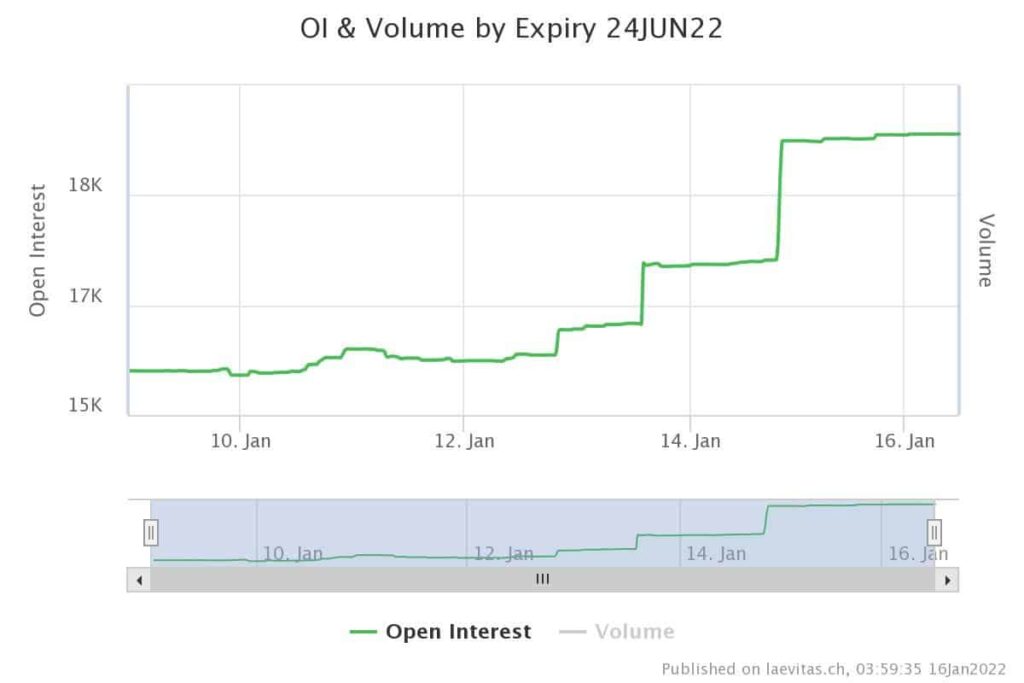
Since last month, the bitcoin price has been consolidating in the $40-42K range. Looking at the options market, a huge trade consists of buying calls for a $40K strike price and selling calls for a $60K strike price (bull call spread) for the 24JUN2022 expiration date.
This trade increased the open interest rate for that particular expiration date. It looks like the $40,000 level is also becoming an important support level in the options market.
Technical Analysis
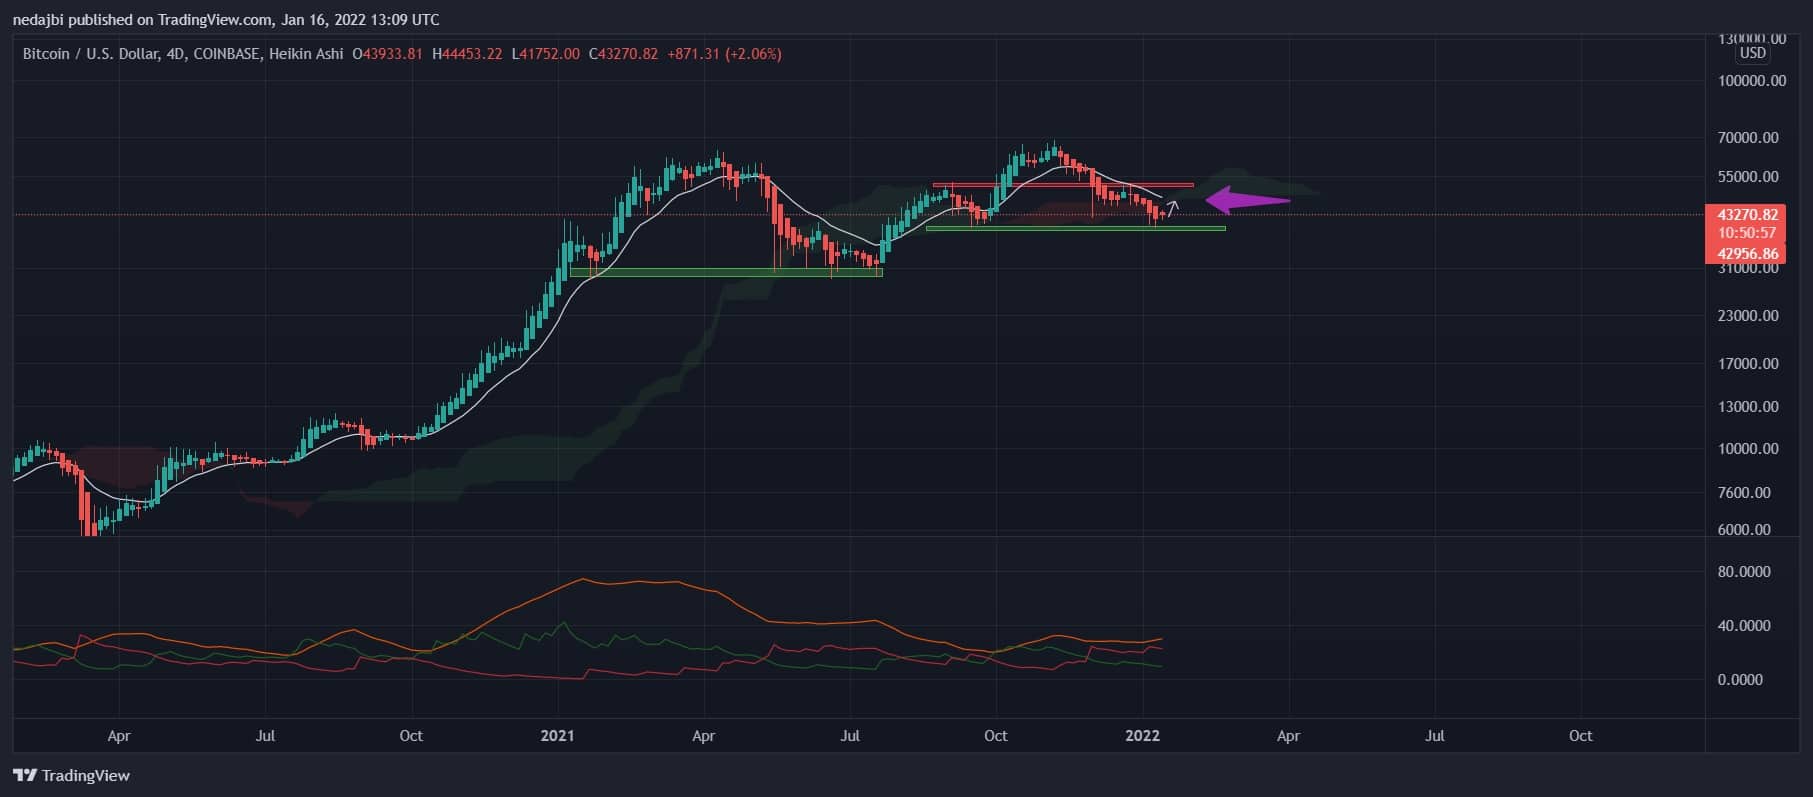
Bitcoin has been trading in a downtrend after reaching its new ATH of $69K in the first half of November 2021. On a 4-day time frame, bitcoin lost the 14 EMA as dynamic support, and struggled to break above the 14 EMA on 27 of December.
Since then, this exponential moving average (EMA) has turned into a tough resistance line. It looks like bitcoin will attempt to break above this key EMA over the next few days.
Therefore, there are two important resistance levels for an immediate price recovery; The Ichimoku cloud – ~$46K – and the 14 EMA at ~$44.7k. Additionally, the DMI indicator -DI (red line) is still above +DI (green line). An ascending trend is usually confirmed when +DI > -DI.

Short term analysis
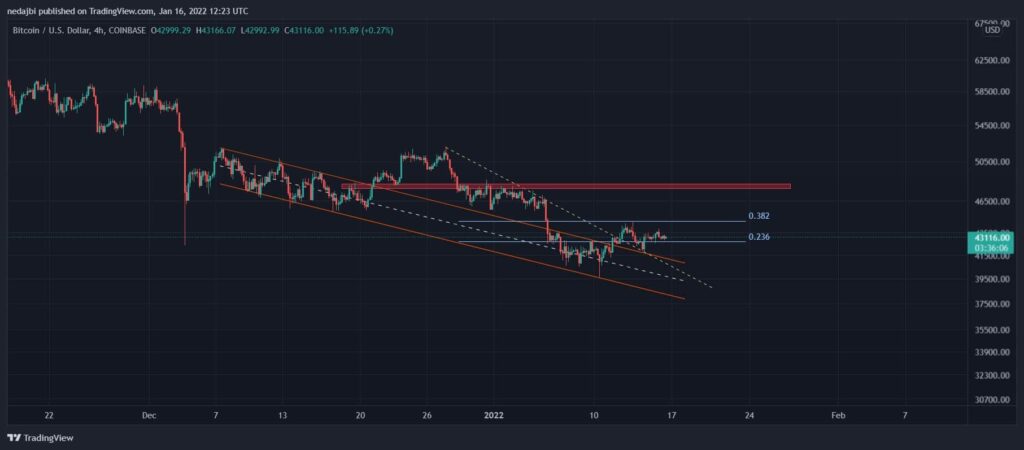
Bitcoin broke out of a descending channel on December 21 within the 4-hour time frame. BTC couldn’t get above $52,000 and then the price quickly dropped.
This caused bitcoin to turn back into the channel and find support by the $40K level once again. For the second time, bitcoin broke out the descending channel.
Based on the Fibonacci retracement levels, the 0.382 and 0.236 levels acted as resistance and support respectively. In order to move higher in the short term, bitcoin needs to break above the 0.382 Fibonacci level, which sits at $44.5,000.
Onchain Analysis
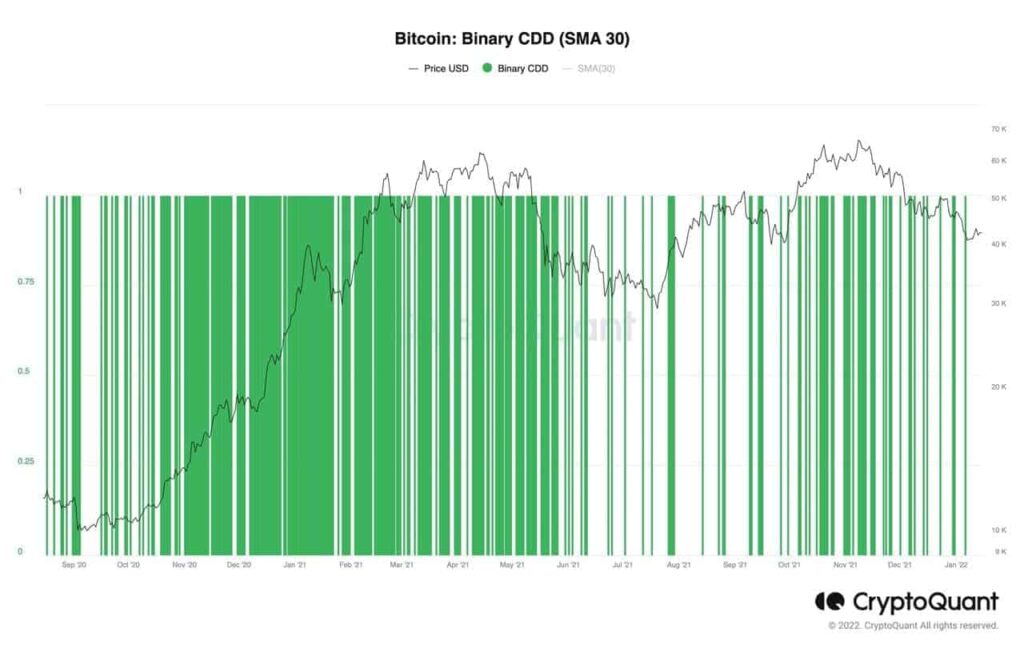
Binary Coin Days Destroyed is a binary value. If Supply-Adjusted Coin Days Destroyed is larger than the average Supply-Adjusted CDD, Binary Coin Days points to ‘1.’ If not – it points to ‘0’.
This metric indicates whether the movements of long-term holders are above or below the average. From the last leg up to the $40,000-$42,000 range, the intensity of BCDD=1 has been decreasing. This means that long-time holders do not spend their coins at a high rate.