The Bitcoin Dominance Rate (BTCD) has been declining since October 2020 and hit its lowest value since 2018 on January 3, 2022.
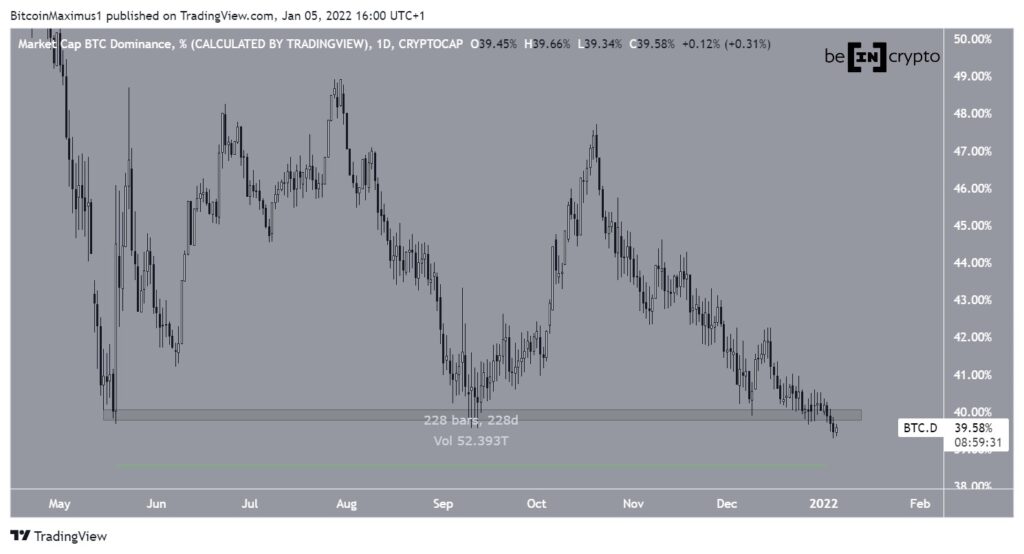
BTCD has been trading above the 40% horizontal support area since May 2021, or more accurately for 228 days. The zone initiated two rebounds, the second of which was weaker than the first.
On Jan 3, it broke down from this area, in what is potentially the beginning of a longer-term downward movement.
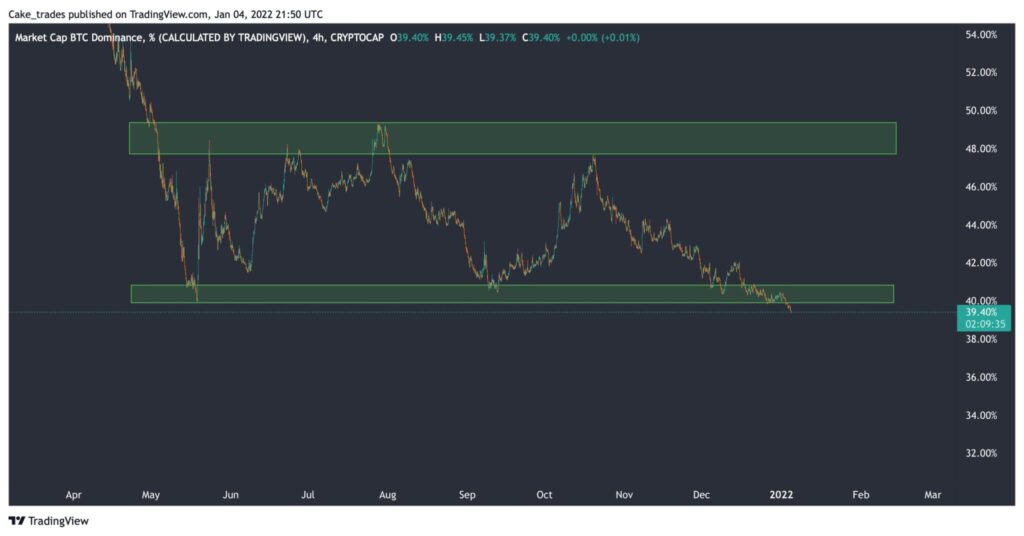
Cryptocurrency trader @kucakeC tweeted a BTCD chart, which shows the token has fallen below a long term support area. This is the same area depicted in the image above.
Current resistance
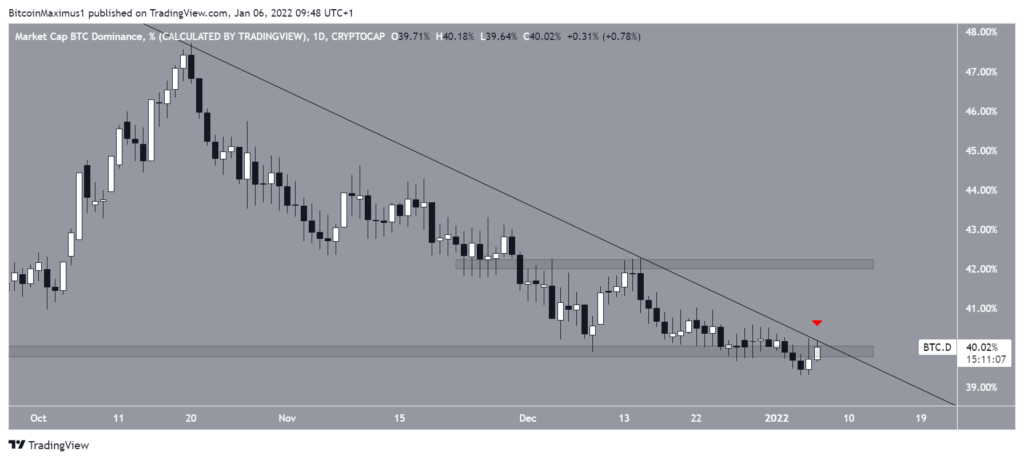
The daily chart also shows that BTCD has been following a descending resistance line since Oct 19. Currently, it is testing it alongside the 40% horizontal support area, which is now acting as resistance.
Due to the confluence of these two factors, this is a very important area of resistance.
If BTCD were to break out, the closest resistance area would be at 42%. However, as it stands, there are no signs that suggest a breakout will occur.
Future BTCD movement
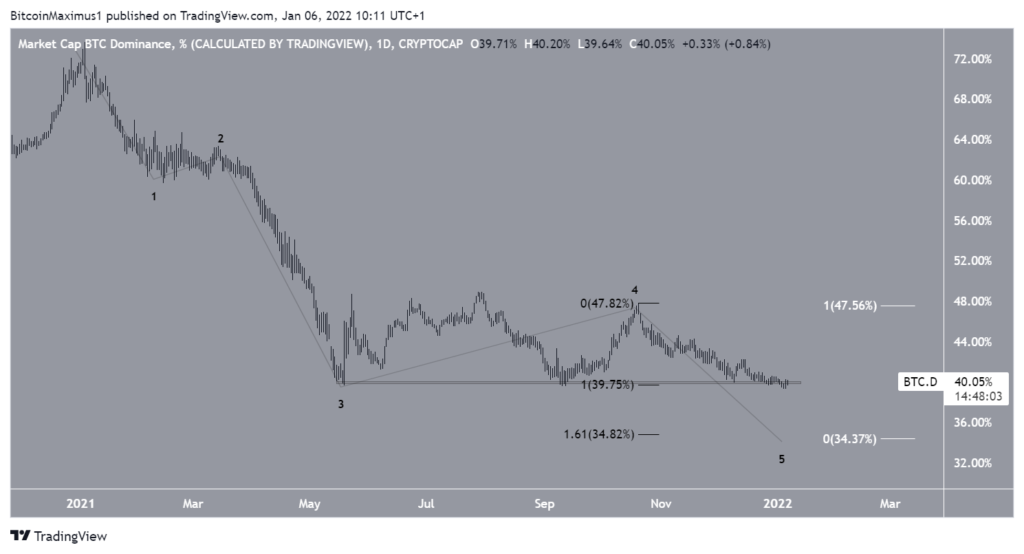
Longer term, BTCD has been declining since the start of 2021. The decline looks like a five wave (black) downward move, in which BTCD is currently in the fifth and final wave.
The most likely target for the bottom of the movement is at 34%. The target is found using the 1.61 external retracement of wave four (black) and the length of wave one (white).
Once the target is reached, an upward movement is likely.
Therefore, while an absolute bottom has not been reached yet, it is likely that it will be reached soon.