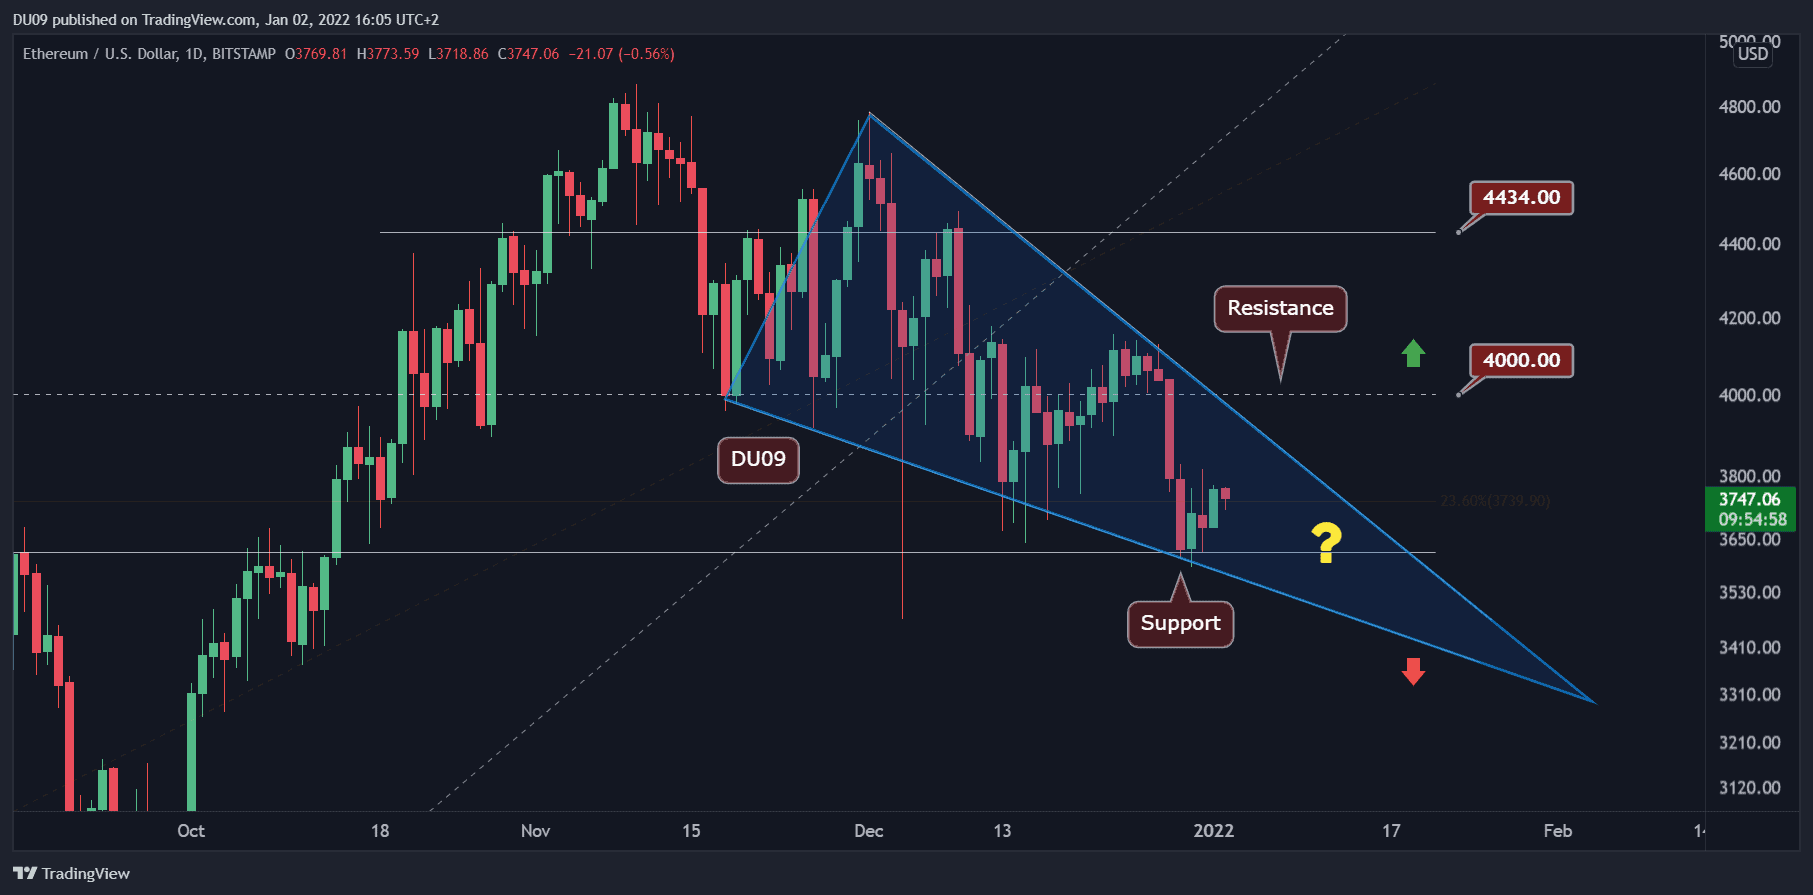
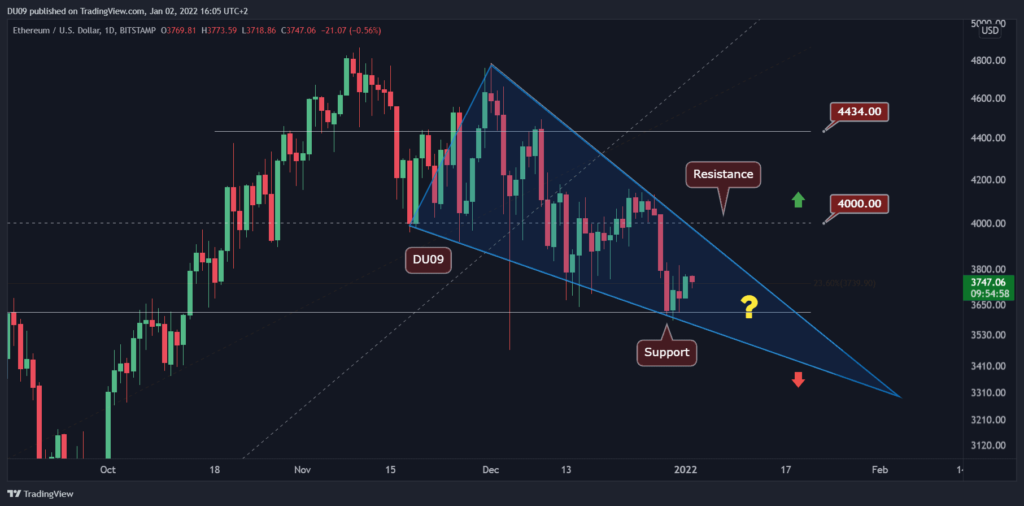
Over the past few days, ETH has traded inside a descending wedge formation. The next significant price move will likely take place during a pattern break.
Key assistance levels: $ 3,600, $ 3,300
Key resistance levels: $ 3,800, $ 4,000
ETH has managed to hold above the key support at $3,600. Since then, the price is heading towards the upper boundary of the descending wedge (marked blue on the following chart), which will likely act as resistance. As of now, this level lies around $3,800.
If the price of ETH manages to break out of the wedge, which is a classic bullish formation (most breakouts are on the bullish side), then ETH will attempt to target the resistance of $ 4,000 again.
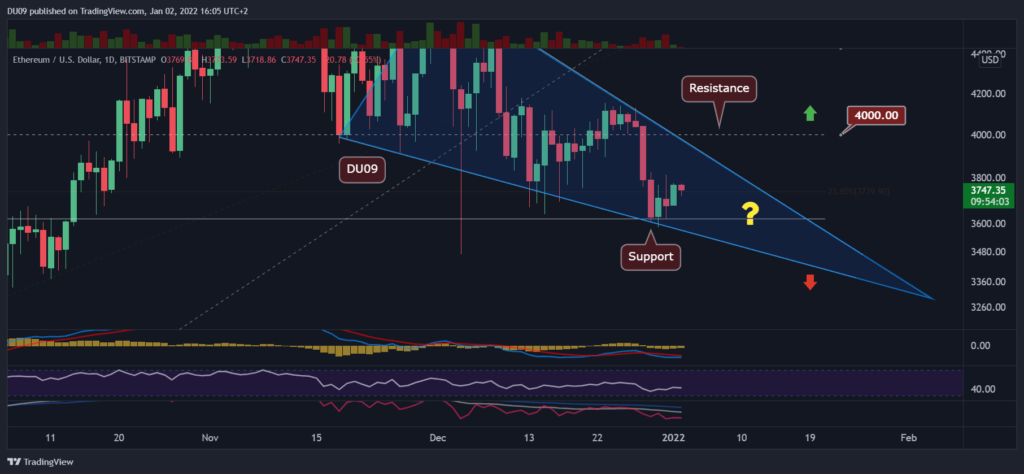
Technical Indicators
Trading Volume: Decent volume recorded when ETH had tested the key support level of $3,600. However, the price is struggling to move higher and volume vanished as it moved up, which is usually a bearish sign, that shows that bears are in control of the market. Likely for ETH to drop again due to lack of momentum in the near term.
RSI: Daily RSI has hit a low and has so far failed to hit a high. It’s a bearish sign and probably won’t change until the price comes out of the corner.
MACD: While the daily MACD is bearish, the histogram makes higher lows, which is a bullish divergence that may come into play as soon as ETH breaks above the wedge (in the bullish case).
Bias
The bias for ETH is bearish. This bias could change in case ETH breaks above the wedge, followed by a decent volume.
Short-Term Price Prediction for ETH
ETH is looking bearish over the short term. However, on a longer timeframe, the ETH price may break above the descending wedge, leading to a renewed interest in ETH.
Until a breakout occurs, price will likely continue to rebound within the limits of the corner. In the event of a bearish breakout, ETH will likely test the next major support level at $ 3,300.


