
Ethereum has been within a respectable uptrend over the past couple of months. Currently trading above the 100% Fibonacci level of its July low, ETH appears to be aiming for crucial milestones at $ 5,000, $ 6,000 and the 200% Fibonacci level at $ 7,058.
Before these long-term targets are met, it’s worth noting that ETH is due a near-term correction. An overbought RSI and a possible triple top along the MACD suggested a new wave of selling pressure.
However, ETH can be expected to touch $5,000, before a drawdown is witnessed.
Ethereum chart in 4 hours
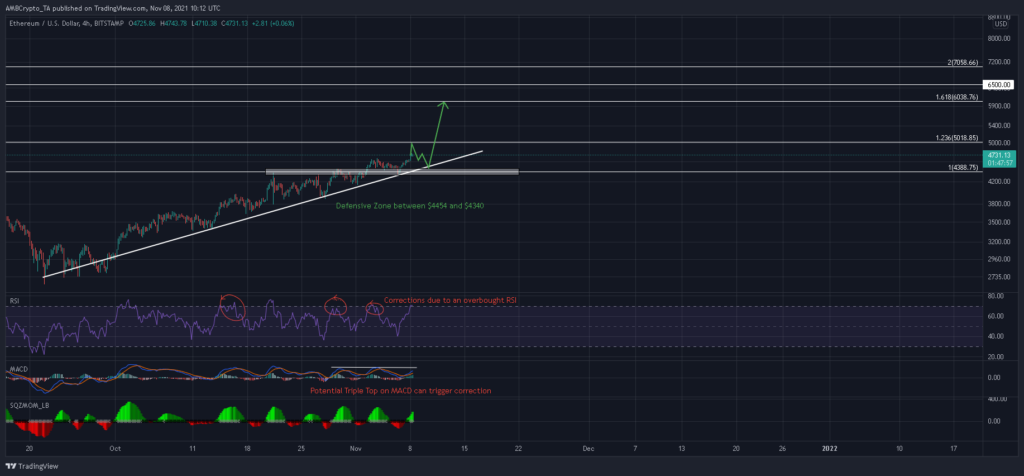
Since reversing its lower trendline on October 1, Ethereum has started an unwavering rally, which peaked at its press level of $ 4,731. Following several correctional phases, ETH tagged its bottom trendline on three occasions while maintaining its streak of higher lows.
Now, given that the bullish momentum still relies on the Squeeze Momentum indicator, ETH could extend its gains up to $ 5,000 during its current bull cycle. However, a correction can be expected thereon.
This, in large part due to the fact that his hourly, 4-hour, and daily RSI were at overbought levels. In fact, three out of the last 4 occasions resulted in drawdowns whenever the 4-hour RSI touched this upper territory.
From there, support found anywhere above or at the 100% Fibonacci level would allow ETH to maintain its uptrend while looking for new highs.
Reasoning
Now, the Squeeze Momentum Indicator registered a series of green bars within a volatile market. The MACD was also forming another peak following a bullish cross. These signs seemed to set the stage for further gains before a correction set in.
However, investors would eventually react to an overbought RSI and cash in their gains. A triple top along the MACD would also present lucrative sell signals.
Conclusion
Ethereum can be expected to tag $5,000 before the next wave of corrections hits the market. If the bulls convincingly exceed that mark, ETH could even mark its Fibonacci level of 123.6%.
Once a drawdown is initiated, the focus should be on a few defensive regions along the lower trendline. Short-term support was available at $ 4,544 and $ 4,388.


