
This time on its four-hour charts, XRP has made a golden cross, marking a significant technical milestone.
When a short-term moving average, like the 50-period moving average, crosses above a long-term moving average, like the 200-period moving average, it is known as a golden cross and is frequently seen as a positive indicator.
Particularly on a four-hour chart, a golden cross is said to be a sign of impending positive mood and short-term price action. Golden crosses are not infallible, though, and other variables including macroeconomic conditions, trade volume, and general market patterns frequently affect how successful they are.
Given that XRP’s price has dropped by almost 5% over the past day under this technical configuration, it is unclear if this signal will still lead to a positive reversal.
At the beginning of October, XRP’s four-hour chart displayed a death cross, and weeks later, the price dropped to a low of $0.487. In order to ascertain if the recently created golden cross may result in a prolonged price increase, the market will be closely observing XRP’s performance.
XRP price drop, cause for concern?
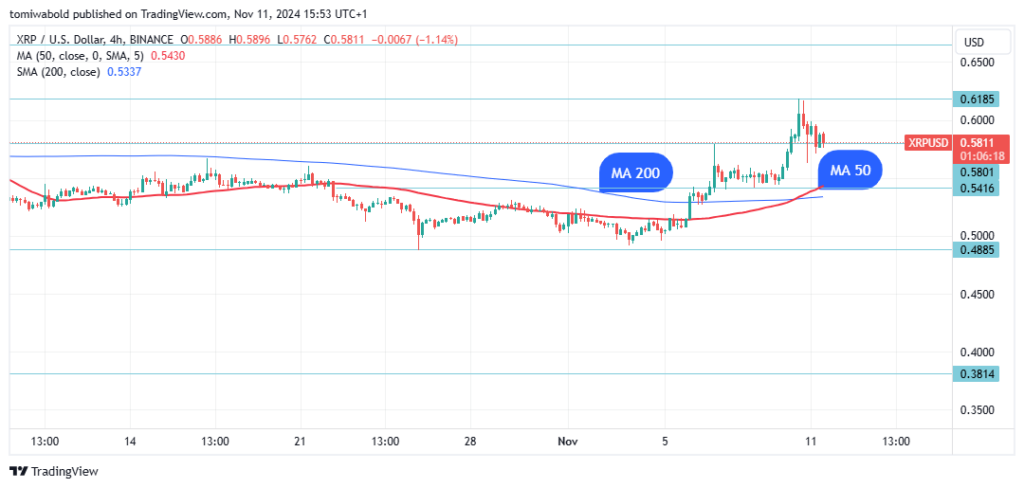
The price of XRP has dropped by almost 5% over the past day, despite the golden cross pattern. At the time of writing, XRP was trading at $0.582, down 2.81% per day.
Bulls were unable to maintain the advantage, as XRP fell to a low of $0.57 during today’s trading session after reaching a high of $0.618 on Sunday.
After recent rises, some investors—especially those who bought XRP at a discount—may be locking in profits. Despite favourable technical indications, such profit-taking may cause the stock to experience short-term negative pressure.
It may be crucial for XRP to maintain above vital support levels in the days ahead. The strength of the golden cross as a bullish indication may be shown if it keeps a strong foundation in spite of the price decline.


