It appears like XRP is poised for a significant technical change that may either initiate a bullish period or make it more difficult for it to continue rising. A bullish signal known as the golden cross is poised to materialise, as the 50-day exponential moving average (EMA) is set to cross above the 200-day EMA.
It is crucial to maintain the present price level at $0.56 since any pausing or decline might prevent this bullish crossing from happening. In recent weeks, traders have noticed a range of trading volumes and price changes in XRP, which has made them apprehensive. Although XRP’s real trading volume has varied, the most recent data shows a significant decline to about $254 million.
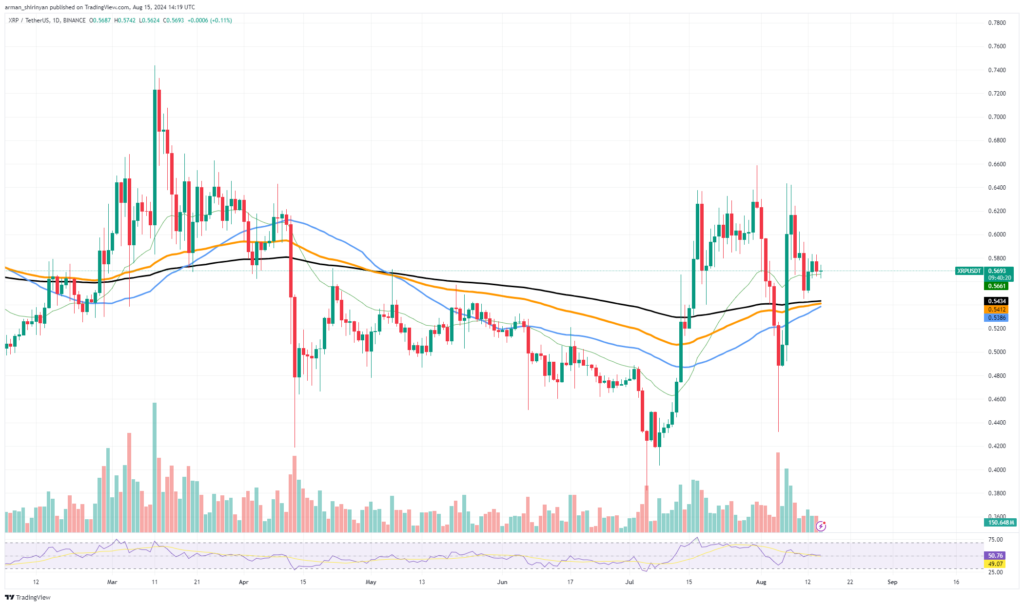
Concerns are raised by this decrease in trading activity as it might be a sign of a dip in market participation, which could erode and reduce any upward momentum. The technical indications indicate a state of uncertainty. The 50 EMA is getting closer to the 200 EMA, and it looks like a golden cross is about to happen, but there may not be much trading activity to support this crossing.
Solana faces issues
Solana has reached a turning point as it has touched its 200-day exponential moving average (EMA), a crucial support level that can determine its future move. At about $144.59, SOL is presently testing the strength of its long-term support following a period of turmoil on the bigger cryptocurrency market.
The 200 EMA has typically supported SOL at a level that is just over the $140 barrier. Another significant support level is located around $130, thus a fall below this level may trigger more drops. However, if SOL is able to keep moving above the 200 EMA resistance levels to keep an eye on the $150–$155 area, a potential rebound might be started.
The 50 EMA, which is now around $152, is another critical key in the near future. If this moves higher, it may indicate a bullish reversal; if it stays lower, SOL may continue to consolidate, bouncing between the 200 EMA support and the 50 EMA resistance.
The limited trading activity shown by the volume indicator suggests that traders are delaying action while closely monitoring SOL’s reaction to these important levels. The RSI, which is now hovering around 44, indicates that SOL is neither overbought nor oversold. This implies that depending on the overall condition of the market, the price may change in either direction.
Shiba Inu is anemic
Shiba Inu is still facing problems as a result of its poor performance, which is characterised by extremely low volatility and declining interest from significant investors, commonly known as whales. Right now, SHIB is trading at about $0.00001368, failing to break out from its downward trend and remaining stable for a while.
A major worry for investors and traders alike is the low volatility. It is challenging to generate money with low volatility assets since they often see minimal price fluctuation, particularly in a market as turbulent as the bitcoin market. This is clear from SHIB’s current trading activity, as the price is stuck in a narrow range and doesn’t appear to be heading back towards its earlier, powerful rises.
SHIB’s issues are becoming worse since whales are leaving the asset on a regular basis. Recent on-chain data indicates a dramatic reduction in big transactions, with only 30 registered in the previous 24 hours.
The stark difference with the seven-day high of 69 significant transactions indicates that key participants are losing trust in SHIB’s future prospects. If the pattern of falling whale activity continues, it might lead to more severe price falls since it exacerbates the low liquidity issue.


