
Although Bitcoin achieved a significant milestone by breaking above the $70,000 barrier, not everything is perfect. That being said, a double top pattern that is forming on the chart around the $71,900 line should alert traders to a potentially hazardous pattern.
What is a double top pattern exactly? This pattern is typically seen as a negative reversal indication, indicating that it could be challenging for the asset to rise further. It appears when a price peaks, dips, then rises to the top again before starting to decrease.
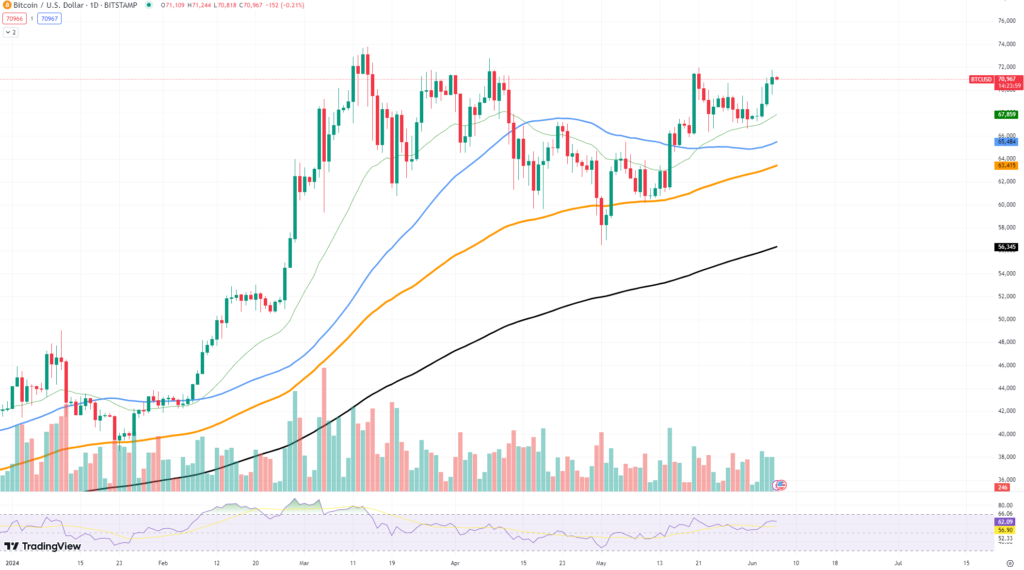
This second high suggests that the bullish impetus is fading, and a negative trend might follow. As the current chart shows, after hitting $70,000, the price of Bitcoin attempted to advance but ran into resistance about $71,900.
If Bitcoin is unable to break through this barrier and retreats, the completion of the double top formation might signal the end of the current surge. Numerous indications lend credence to this cautious attitude. Overbought levels usually precede a price correction, and Bitcoin is getting close to these levels based on the RSI.
Additionally, during the most recent upward advance, the volume did not grow significantly, which would suggest that the purchasing pressure is decreasing. But remember the bigger picture as well. Despite these warning signs, Bitcoin has historically shown bullish behaviour and durability, often outperforming technical analysis patterns.
Thanks to the ETF, institutional interest and general adoption are both increasing and the current market attitude is primarily favourable. Traders must use caution. Bitcoin may confirm the double top pattern and experience a price decrease if it breaks below the $70,000 support level.


