With a rebound off of the 50 EMA, which has been seen as a solid support level for the asset, Shiba Inu has made a significant comeback to the market. Fortunately, SHIB lived up to our expectations and achieved the breakthrough that many had anticipated. On the other hand, focusing only on a fast advance up might not be the best course of action because there are many obstacles ahead.
The 50-day EMA, often known as the blue line, has provided SHIB with consistent support, enabling it to attempt a resurgence. This recovery offers traders the confidence they need to halt the more significant slide that started more than a week ago, as well as optimism for a turnaround.
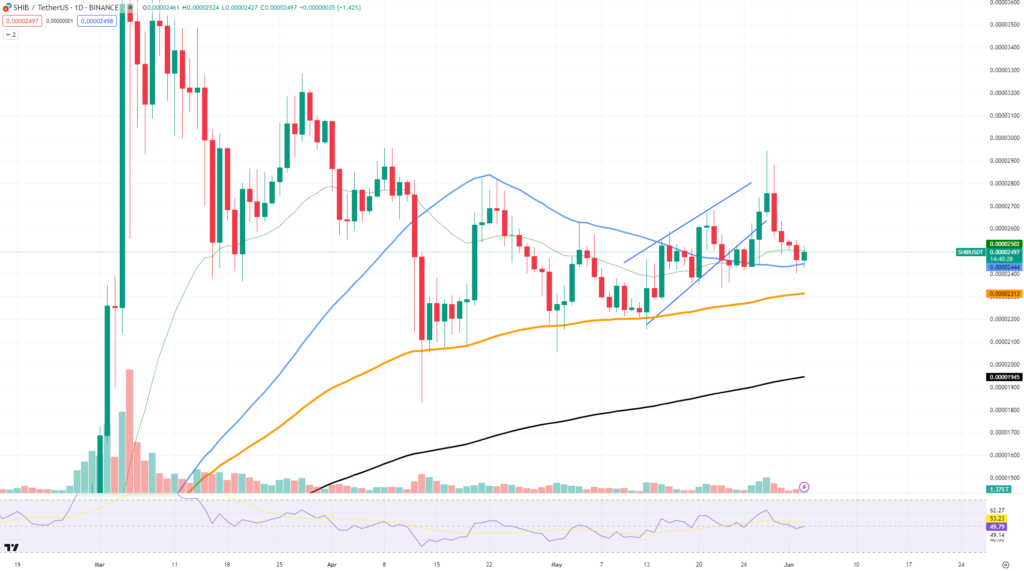
The fact that SHIB is presently trading above the 100-day EMA is another positive indication from the moving averages. Being above the 100 EMA, a common midterm trend indicator, might mean that the overall trend is about to become more bullish.
The 50-day EMA is still above the current price, so it can act as resistance in the immediate term. The trade volume bars show that there has been more trading activity during the most recent price fluctuations.
This spike in volume often corresponds with significant price movements and may be an indication of strong market interest. However, SHIB needs a consistent high volume in order to get over the present obstacles and see a long-term rising trend.
In addition, the RSI shows a value of 50. SHIB seems to be in a neutral zone, neither overbought nor oversold, therefore there is room for movement in either direction. An rise in the RSI towards 70 can be a sign of overbought circumstances. SHIB is in the middle for the time being and is not likely to provide us with any information on the impending relocation.


