
The price is finally emerging from a recent downturn, as indicated by the Solana daily chart, where a string of higher lows is creating a tentative ascending channel. Around $74.73, which corresponds with previous low points and a dynamic support line that has been respected in the recent market movement, is the local support level. The recent peaks are establishing a possible resistance zone, and the resistance is located close to the $99.59 level on the upside.
We may expect a positive situation where SOL/USDT hits the upper border of the current channel if the price stays inside the ascending trend line. A clear break over the resistance level of $99.59 would trigger a retest of the crucial $100 level, which might extend advances towards the next major resistance level around $110.
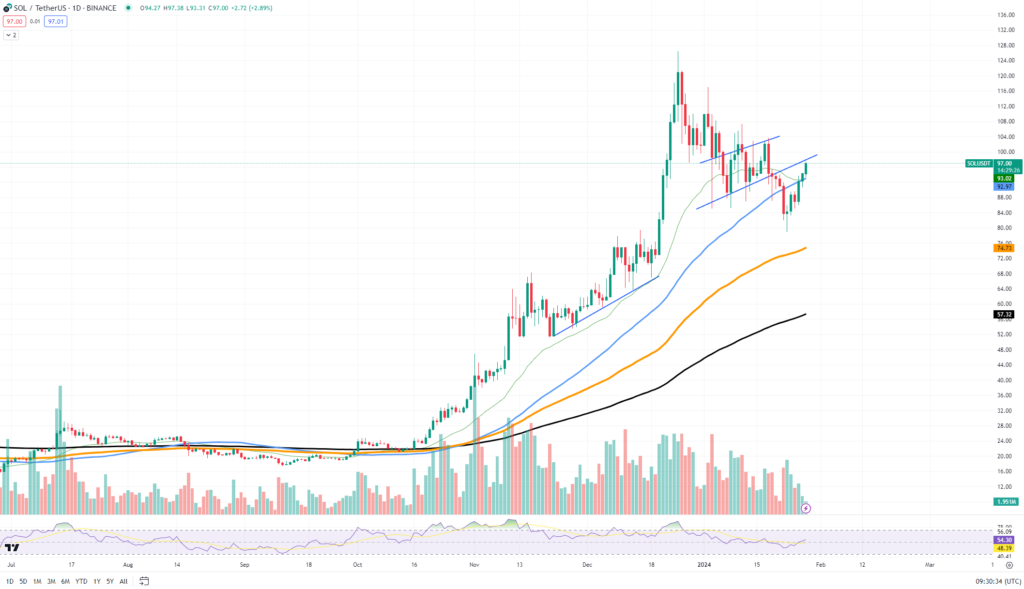
On the other hand, a price breach below the $74.73 support level may invalidate the bullish perspective and indicate a negative situation. A break below this support level might lead to a fall below the stronger historical support level of $57.32. A significant psychological and technical support level, the $50 zone, may be challenged by the market if there is more deterioration.
Crucial pattern
The most notable pattern is an inverted double bottom, with two separate troughs signifying a break from the previous downward trend. This pattern’s neckline is located approximately at the ETH level of 0.04243.
By calculating the distance from the neckline to the bottom of the troughs and extending that distance above the neckline, a verified breakout above this neckline might project a target.
Indicating that a rise in the SOL/ETH pair is possible if SOL breaks above the neckline with conviction, the inverse double bottom pattern is usually a bullish reversal indicator.


