
The major participant in the smart contracts market, Chainlink, has recently experienced a significant amount of buying activity that may indicate a turning point in the market. A noteworthy whale deal was witnessed after a price decline, when 601,949 LINK were bought for an astounding $8.9 million, with an average price of $14.81. The fact that this purchase was split up over three new wallets suggests that it was a calculated action as opposed to impulsive trading.
The market appears to be poised for an intriguing event, according to the Chainlink chart. At the moment, LINK is teasing the 50-day EMA, which is frequently used as a boundary between bullish and bearish areas. It’s important to note how close the 50 EMA is; a strong push above it might inspire bulls, while a failure to break it could inspire bears.
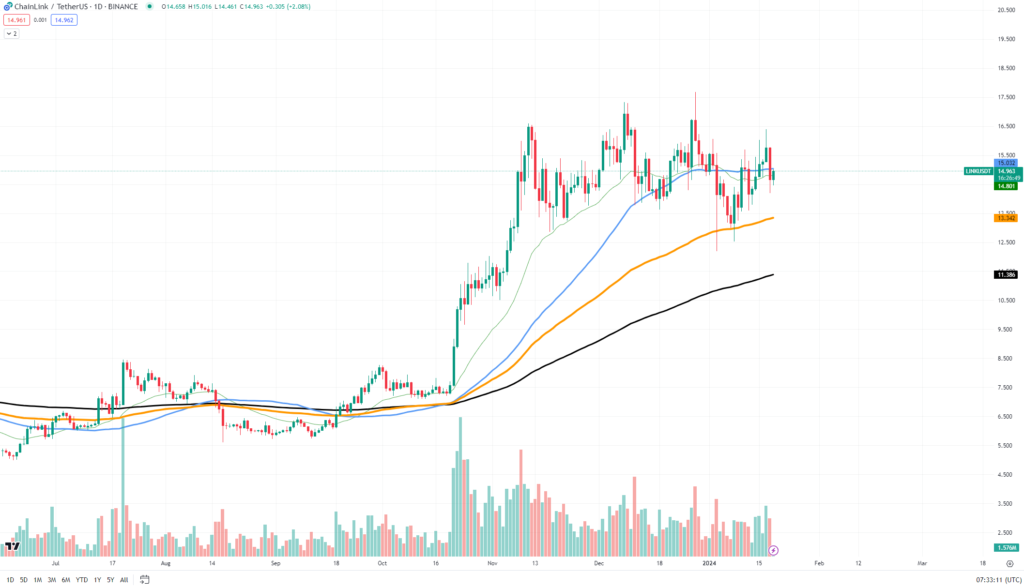
LINK is now showing indications of consolidation, gradually eroding a route in what traders call to as a “crab” market – a market that is moving sideways with no discernible long-term trend. The asset oscillates around a central price point, which in the case of LINK is now the 50 EMA, throughout this consolidation phase.
Maintaining support at the 50 EMA, which is presently at about $14.80, would probably be necessary in a growth scenario for LINK before there is a significant increase in volume and price. If this happens, it would show that this level has been well defended and may pave the way for a bullish reversal. The next area of local resistance to keep an eye on is around the $15.00 level, which, if overcome, may indicate the conclusion of the consolidation stage and the start of an upward trend.
If, on the other hand, LINK is unable to maintain its position above the 50 EMA, we may witness a regression that takes it back to test the $13.30 local support level. A decline below this may bolster the pessimistic assessment and perhaps result in more losses.


