
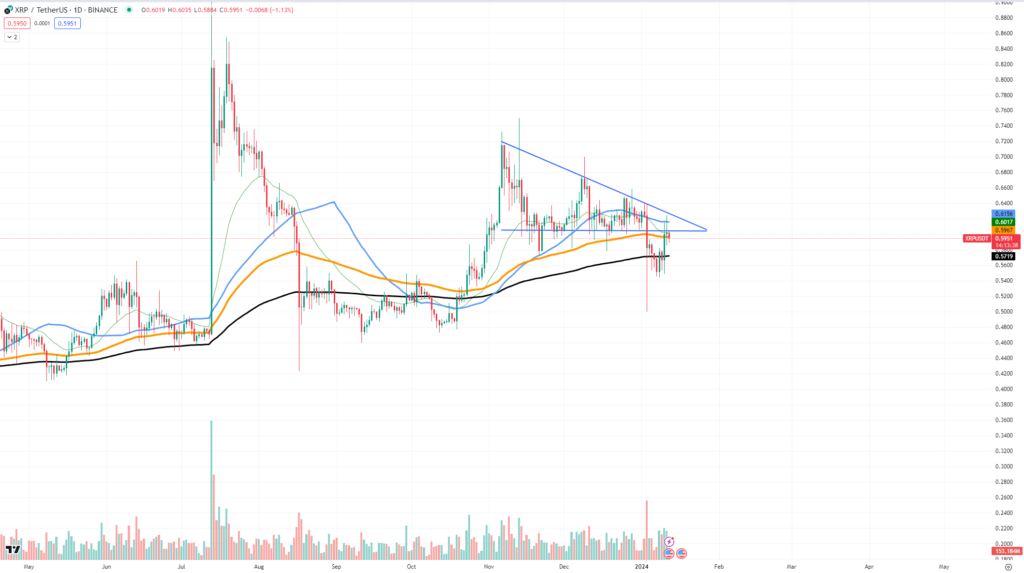
Notwithstanding the challenges, XRP’s price behaviour suggests that a collision with the $0.6 resistance level is imminent. Taking a closer look at three href=”https://www.tradingview.com/”>The XRP/USDT chart is set up to perhaps breach this crucial level.
Consistency above EMAs
The 50-day and 100-day Exponential Moving Averages (EMAs), which have traditionally functioned as trustworthy indications of underlying strength, are now positioned between the price of XRP. In recent times, the price has often bounced off the 50-day EMA, which has shown to be a reliable support level. Given that each bounce off the EMA has reduced the resistance overhead, this consistency points to significant buyer interest that could be enough to push the price beyond the $0.6 barrier.
Descending triangle invalidation
The symmetrical triangle’s formation and the rejection of the descending triangle may indicate that XRP is preparing for a major move. The intersection of the converging trend lines is the breakout point to keep an eye on. A breakout would be validated by a spike in volume, which might push XRP above the crucial $0.6 resistance level. The probability of a breakthrough rises as XRP gets closer to the point where the symmetrical triangle meets its peak.
Historical resilience and recovery
Current market dynamics take into account long-term performance. The capacity of XRP to bounce back from big declines in the past gives investors more assurance. The tenacity of XRP is demonstrated by its past price action, as it has already surmounted notable resistance levels during its recovery stages. This history of success can psychologically support market mood and encourage XRP to break over the $0.6 resistance level.


