
At the moment, XRP is negotiating a hazardous market environment. The token’s value has dropped by almost 9% as a result of a major correction. The XRP/USDT chart is getting close to a critical support level that might determine the direction of the coin in the next days after the regrettable collapse below the descending triangle pattern.
Due to its recent price movement, XRP is now approaching the 200 exponential moving average (EMA), a crucial indicator that frequently serves as a yardstick for the long-term direction of the commodity. Most people consider the 200 EMA to be the “last resort” when it comes to being optimistic. If XRP falls below this barrier, it may lead to a protracted reverse and possibly stop the current upswing.
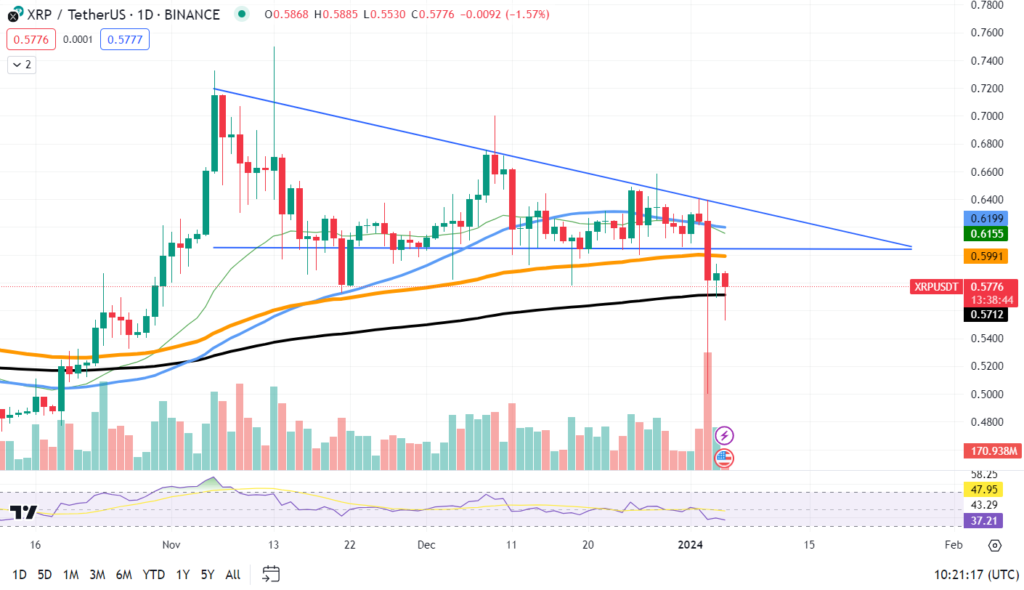
Looking closer at the chart, we can see that XRP’s local support level is located at or near the $0.57 mark, which is also the area where purchasing pressure was previously seen. A bounce off this level would indicate that the bleeding has temporarily stopped, providing holders with some relief. The resistance level to keep an eye on is now situated close to $0.61, a barrier that might thwart any attempts at an instant recovery.
The existing network and increasing uptake of XRP’s payment protocol continue to be its strongest points. But at the moment, the bearish technical pattern obscures these basic factors. The coin’s inability to stay above significant moving averages (EMAs) demonstrates how fragile the market is.
The way that XRP interacts with the 200 EMA might determine its future in the foreseeable future. A clear breakdown below this mark may validate the pessimistic picture, but a hold above it might indicate that XRP isn’t quite ready to give up its gains.


