
XRP’s most recent price movement was very unexpected given the state of the market in the days immediately following the holidays. The XRP/USDT chart is poised for a potentially big shift, according to a close examination of the graph. The asset may be preparing for a significant price increase given it has had a slower start to 2024 than Ethereum, particularly in relation to Ethereum’s approach to its local resistance level.
At the moment, the price of XRP is situated at the terminus of a descending triangle, a technical indicator of trend continuance that traders frequently identify. In this case, though, XRP has executed an unexpected move by breaching the top of the falling triangle. This move may be seen as a positive indication, pointing to a shift in market mood and maybe offering support for a rise towards the $0.7 level.
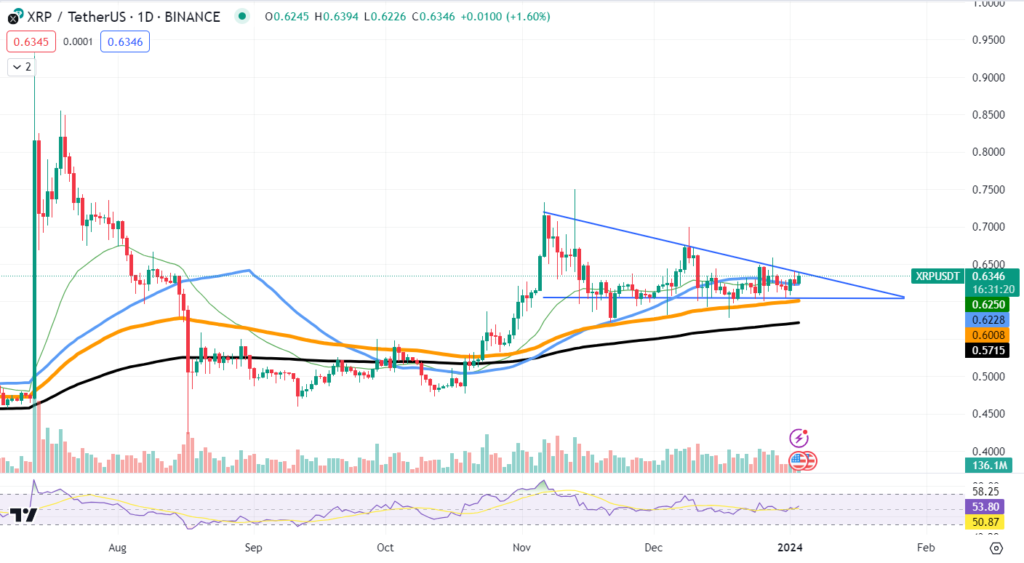
Usually, a downward-sloping resistance line and a flat support line combine to produce a descending triangle. It is important to note that a breakout over the resistance line invalidates the negative bias in the pattern. This development for XRP suggests that buyers are getting stronger and might drive the price higher. This would be especially true if the breakout is followed by a rise in trading volume, which would lend more legitimacy to the move.
Right now, XRP is trading higher above its moving averages, which is encouraging for bulls. The 50-day moving average has supported the price throughout recent declines by acting as a dynamic support. The middle-of-the-road Relative Strength Index (RSI) indicates that there is still potential for price movement higher before the asset is overbought.
Conversely, Ethereum has also come close to a level of local resistance on the market. If Ethereum breaks over this barrier, it may have a domino effect and boost other cryptocurrencies like XRP.


