
On its weekly chart, Bitcoin (BTC), the biggest cryptocurrency by market capitalization, may be headed towards the formation of a fresh golden cross.
The weekly SMA was $29,301, and the weekly SMA 50 was $28,102, both of which were climbing as of the time of publication, according to TradingView data.
Bitcoin has increased seven weeks in a row since mid-October, breaking beyond the $42,000 barrier. In the event that this week ends well, Bitcoin will have increased for the eighth consecutive week.
Crypto-specific elements have played a part in Bitcoin’s incredible 152% gain in 2023; during Monday’s trading session, BTC hit new year highs of $42,410.
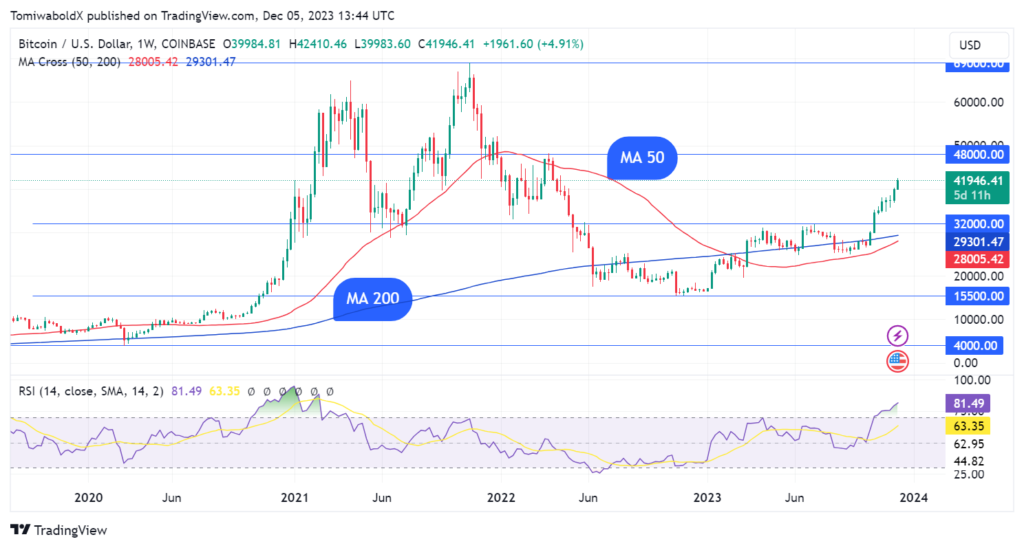
When the SMA 50 crosses over the SMA 200, a golden cross is formed. This suggests that short-term price momentum is exceeding long-term price momentum, perhaps leading to a bull run. This signal suggests that the weekly golden cross for Bitcoin may form in the upcoming weeks.
In the weeks after the September 2021 golden cross, Bitcoin reached a new high of $69,000, citing historical precedents. With the anticipation around the potential debut of a U.S.-based spot ETF, the impending golden cross might live up to its legendary history.
What’s next for Bitcoin price?
At press time, Bitcoin was hovering around $42,000, having climbed to $41,866 on Monday, a significant figure, an increase of 0.15%.
Santiment claims that the excitement following Bitcoin’s $42,000 milestone is still prevalent on cryptocurrency platforms.
Nonetheless, certain technical metrics, like the momentum indicator RSI, might indicate that the Bitcoin rise has reached its limit.
Santiment claims that after crossing $42,000, Bitcoin’s RSI indicates a short-term downturn in the price of the cryptocurrency. In the event that this occurs and the RSI remains at 65, Bitcoin may aim for $50,000 more rapidly.
According to cryptocurrency expert Ali, the key resistance level for Bitcoin is currently around $47,360, while $37,000 has emerged as a key support level.


