
On the price charts, XRP seems to be creating a big pattern that may indicate an impending period of extreme volatility and maybe a fresh breakthrough.
Right now, XRP is lining up around a significant support level at about $0.60, a significant barrier that has served as both support and resistance in the past. This area is turning out to be a major bear and bull battlefield, and its durability may pave the way for XRP’s next significant rise. This level’s stability speaks something about the XRP holders’ unwavering trust, as they appear ready to protect this barrier from market sell-offs.
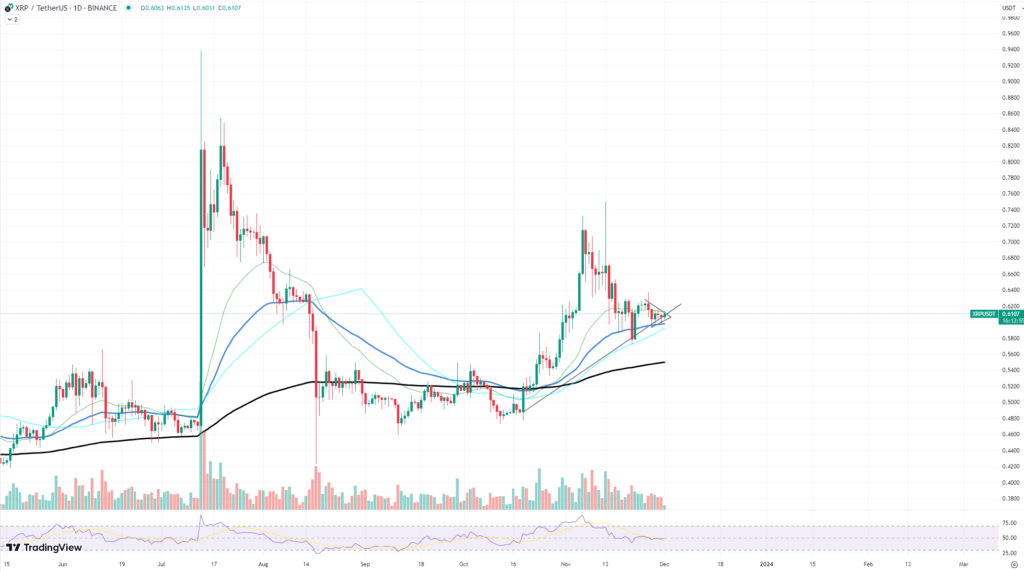
Moving averages that are combining into a narrow range are XRP’s short-term opponents. These include the 50-day and 100-day moving averages, above which XRP has to break out with confidence in order to indicate a change from a consolidation phase to an upward trend. The price may challenge the local resistance level around $0.65 if there is a strong close above these averages. Previous upward advances have been stopped by this barrier; a break above it may open the door to higher values.
The development of a symmetrical triangle, a sign that a market is heating up for a big move, adds to the confusion. When the price approaches the apex and a breakout is about to occur, these patterns are frequently linked to an increase in volatility.
The line in the sand that must hold for bullish predictions to stay viable is the local support, which is steady at $0.60. If this level fails, buyers may intervene to snap up the asset at what they consider to be a bargain, and XRP may see a retest of lower support, maybe at the $0.55 or $0.50 price levels.


