
Recently, Cardano (ADA) displayed a golden cross, a technical chart pattern in which the 50-day moving average crosses over the 200-day moving average. This pattern is sometimes viewed as a bullish indication. But in spite of this generally positive indication, ADA has now entered a correction phase and lost a sizable chunk of its value. The usefulness of the golden cross as an indication in the present ADA market environment is called into doubt by this development.
There are several reasons that have impacted the pricing dynamics of ADA. Following a month of increasing momentum, ADA hit a significant resistance level, which sharply spooked investors. There is a chance for further drops given this barrier and the selling push that followed. But if bullish mood holds, there’s still a chance for a comeback as ADA gets closer to crucial support levels.
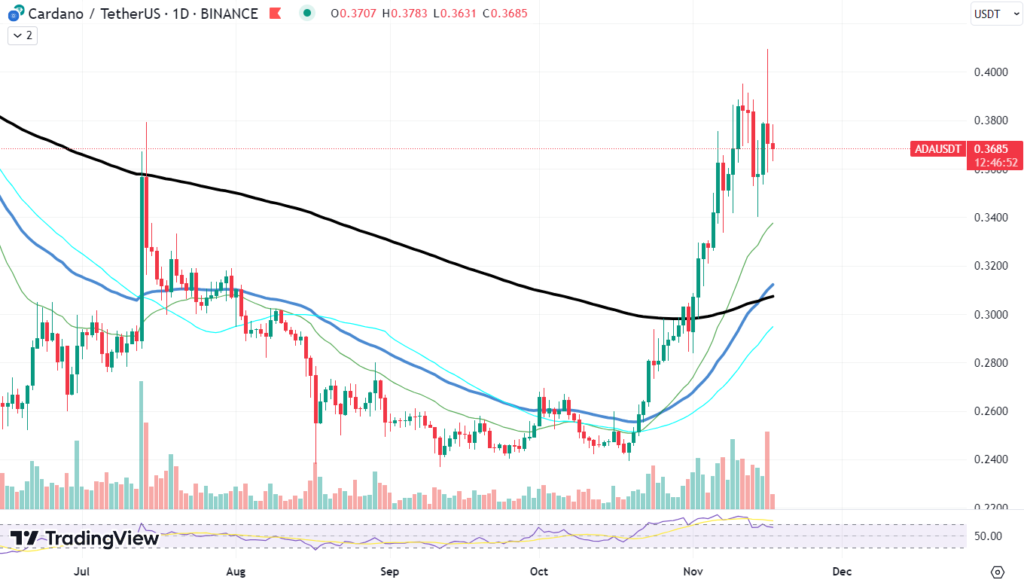
The price of ADA just reversed after forming a golden cross, which might be an indication of larger tendencies in market consolidation. The short-term forecast for ADA offers both positive and negative potential as strong selling pressure builds.
Watch for the critical support level around $0.368—which corresponds to the EMA 10. Should the price of ADA remain over this threshold, it would suggest that the upward trend is still in place. On the other hand, a decline towards the EMA 50 at $0.31 would indicate a waning bullish position and possible further correction.
Given that mood and market circumstances influence ADA’s price action more than a single technical pattern, the recent golden cross may not be the positive trigger that investors had hoped for in this situation. Investors should keep an eye on market movements, on-chain data, and wider economic variables influencing the cryptocurrency industry for a thorough study.


