
An important technical pattern called the Exponential Moving Average (EMA) golden cross has been drawn by Cardano (ADA). In the trading world, this pattern is usually seen as a positive indicator. It arises when a shorter-term moving average, usually the 50-day EMA, crosses above a longer-term moving average, such as the 200-day EMA.
Technical events like these are frequently seen as signs of the beginning of a new bullish trend, and in the case of ADA, they are consistent with the overall positive momentum shown in the company’s recent market behaviour. This bullish outlook is reinforced by the Moving Average Convergence Divergence (MACD) indicator, which shows growing purchasing pressure and favourable conditions for the golden cross to appear in signal lines and histograms.
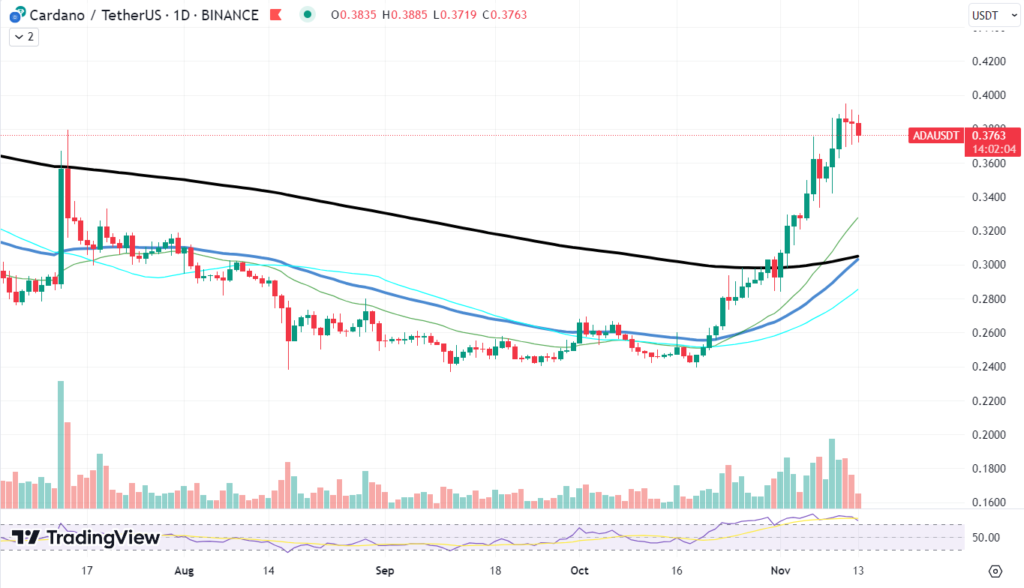
When it comes to price action, the golden cross may herald an upsurge among traders who see it as a buy signal, which might accelerate the advance. Experienced traders know, nevertheless, that when early participants take gains, crossings of this type can also be followed by retracements.
The emergence of a golden cross in ADA can draw in new buyers and push the price up to test the next resistance levels. However, following such a crossing, it is not unusual for assets to retrace as the market processes the sudden shift in sentiment.
There might be a few different outcomes for Cardano if they follow this ADA golden cross. Because of speculative interest and restored confidence, the initial response may cause prices to rise, but market dynamics may also cause a period of stabilisation or even a little decline as traders attempt to profit from the recent gains.


