
As the market for digital assets moves through a downturn, XRP just encountered a major obstacle at $0.7. With the recent market swings raising doubts about XRP’s ability to maintain a breakthrough, many investors view this price point as a significant resistance level.
The current chart shows a sharp turnaround in XRP’s trajectory, indicating that the purchasing pressure near $0.7 proved to be too strong for the ceiling. The value of XRP reached this barrier during a fervent surge, but a strong sell-off followed, as shown by the most recent candlestick’s extended upper shadow. Such price activity can frequently be an indication of an impending slump and indicates a strong rejection.
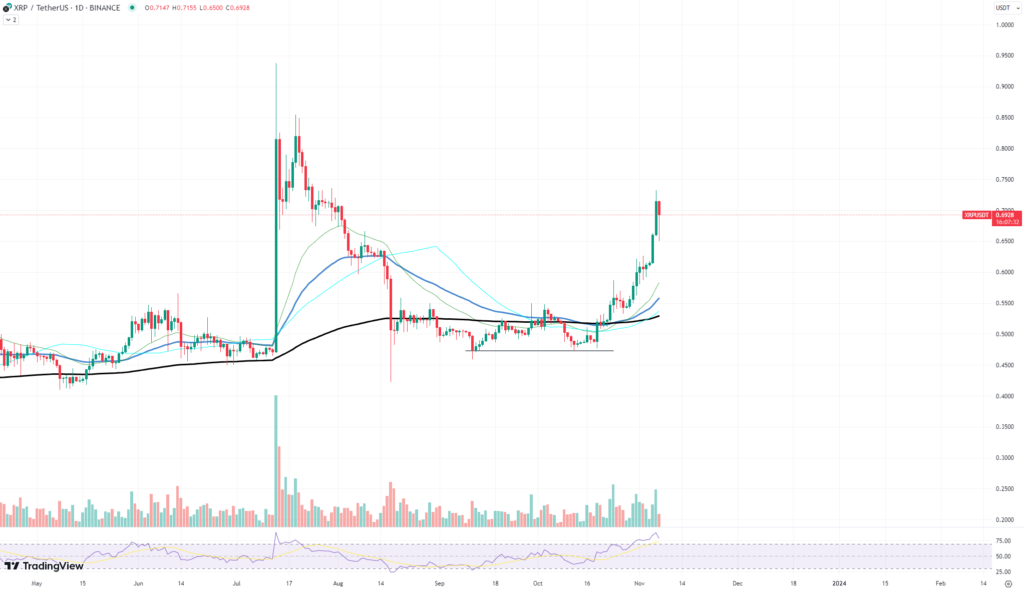
Additional information about the state of the asset may be gained by carefully examining the technical indicators. The momentum oscillator known as the Relative Strength Index (RSI), which gauges the rate and direction of price changes, is showing that the market for XRP is significantly overbought. A reading that is now shown on the chart indicates that the asset may be overextended and may be due for a correction when the RSI surpasses 70.
Furthermore, the moving averages, which are frequently used to determine trend direction and possible levels of support and resistance, indicate that, even with the recent upswing, the quick reverse has brought the price of XRP close to the shorter-term moving averages. This closeness denotes a slowing of the rising trend and might provide temporary support if the price keeps falling.
The significant increase in volume that coincides with the reversal draws attention to the severity of the sell-off and the resistance level at $0.7. Such volume frequently follows significant price changes, indicating a significant shift in the attitudes of traders and investors.


