The current price trend of XRP is evidence of how active the cryptocurrency industry is. XRP’s price has significantly declined over the last two weeks, falling from $0.6436 to a low of $0.4966. The decline of XRP is more than just a little drop; it is a big change that has left a trail of perplexed traders and investors in its wake.
The abrupt increase in trade volume, both adjusted and real, is one of the most remarkable features of this fall. Usually, a rise in trade volume may be interpreted as more activity or interest in a certain item. But when this increase in volume coincides with a drop in price, it frequently denotes a more pessimistic outlook. Large whales appear to be unloading their holdings in the case of XRP, particularly near levels of regional resistance.
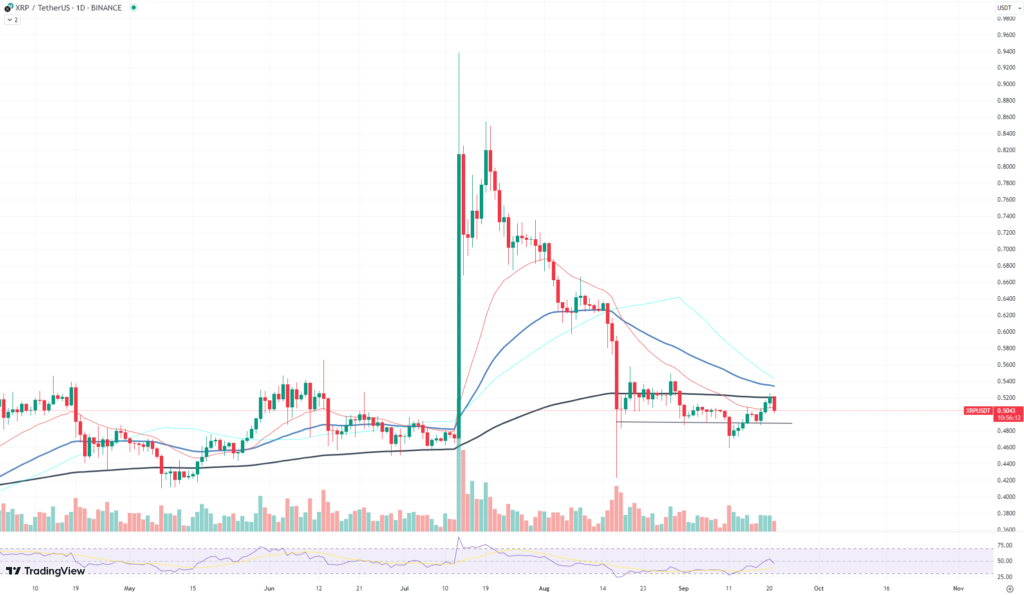
The 200 EMA (Exponential Moving Average) daily line has served as a crucial hurdle for XRP when it comes to resistance. This line has served as a ceiling for the asset for more than a month, keeping it from breaking through and reaching higher price points. The 200 EMA further established itself as a tough barrier because XRP encountered rejection each time it tried to cross this level.
However, why is the 200 EMA so important? The 200 EMA is frequently used in technical analysis as a key predictor of an asset’s long-term trend. Prices falling below this level are typically interpreted as a negative indication, showing that the asset is in a downward trend.
On the other hand, it is bullish when prices are above the 200 EMA. Being restrained by this line for a lengthy period of time for XRP shows that there isn’t enough positive momentum in the market to drive the price up.


