
Analysts of cryptocurrencies are monitoring the chart patterns of Ethereum, particularly the development of a hammer candle on the weekly chart.
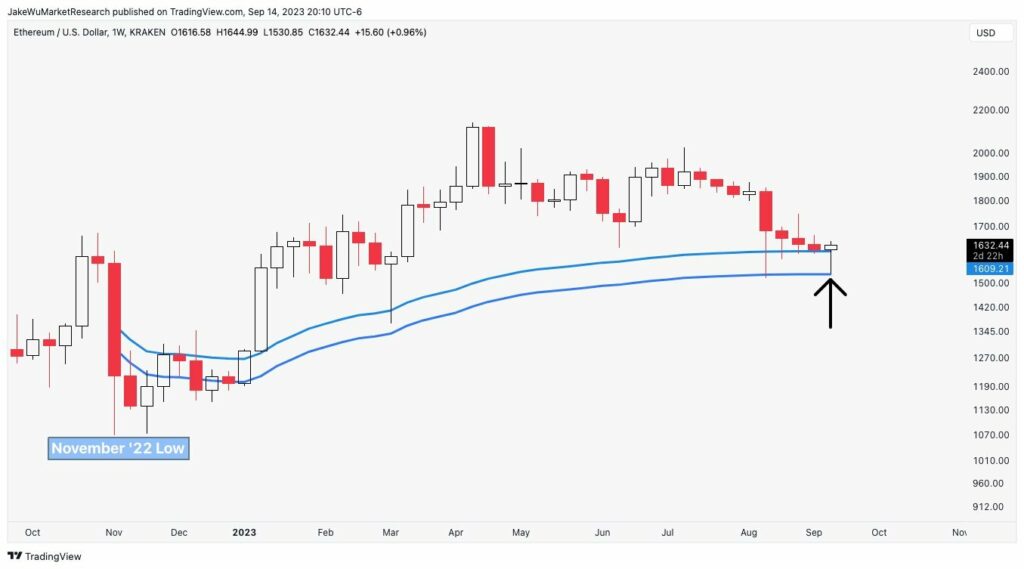
This pattern, according to Jake Wujastyk, comes after Ethereum saw four straight weeks of price declines, which sparked discussions about probable positive reversals.
The significance of the hammer candle
Technical chart patterns like hammer candles are frequently seen by traders as bullish reversal indicators.
The hammer-like design is distinguished by a small body and a long bottom wick.
It often shows up near the bottom of a downtrend, indicating that the asset’s price has “hammered out” a market bottom and may be ready for an upward reversal.
It’s important to remember that no one pattern, however, can ensure future market performance.
Ethereum’s price performance
The price of Ethereum is currently $1,629.96, up 0.6% vs the US dollar but down 0.5% against Bitcoin, according to statistics from CoinGecko.
Ethereum has been trading between $1,616.24 and $1,638.91 during the last day.
The market value of the cryptocurrency is currently above $196 billion, and its 24-hour trading volume is in excess of $7.2 billion.
The hammer candle may be a good indication for those who are confident in Ethereum’s future following several weeks of price declines. But it’s still best to exercise cautious. Before making any investing decisions, many seasoned traders frequently look for further confirmation indications and take a comprehensive perspective of the market.


