An important technical parameter indicates an uncharacteristically calm market with historically low levels of market volatility for Bitcoin.
The Bollinger Bands, a volatility indicator used in technical analysis, on Bitcoin are “the tightest [they] have ever been on the weekly timeframe,” according to renowned cryptocurrency expert Josh Olszewicz.
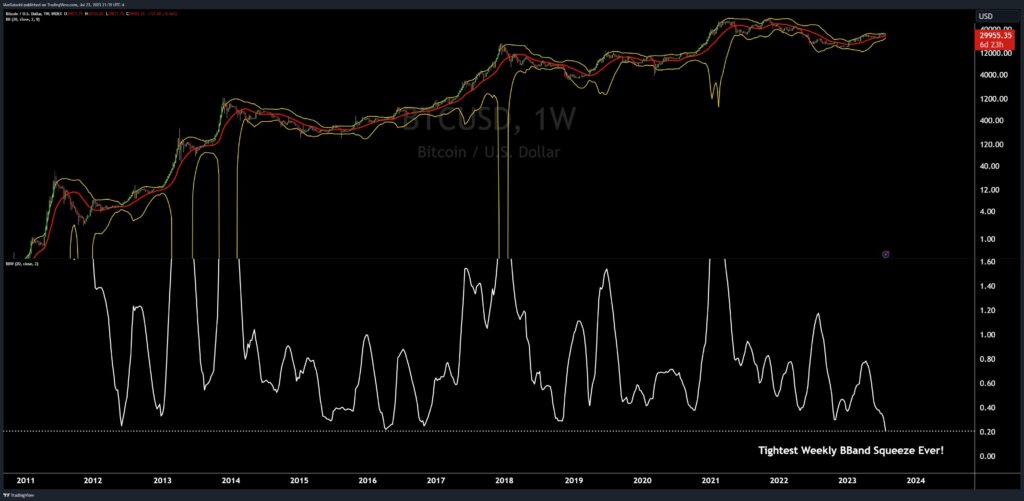
With the tightening of these bands indicating less price variations, Bollinger Bands are a sort of statistical chart used to analyse the price and volatility over time for a financial asset.
Simple moving average (SMA) and two standard deviation lines are displayed above and below each other to form Bollinger Bands. The predicted trading range of the asset is represented by the space between the two bands.
The market is seen to be less volatile when the bands are narrow, and vice versa. Olszewicz’s finding in the instance of Bitcoin shows that the price of the cryptocurrency is presently going through a period of low volatility.
It’s interesting to note that this decrease in volatility is not specific to Bitcoin. Additionally, Olszewicz said that Ethereum (ETH), the second-largest cryptocurrency by market size, is currently witnessing the “tightest B-Bands on weekly timeframe ever.”
This simultaneous tightening might be a sign of a wider market trend, making the cryptocurrency market less attractive for traders looking for bigger swings but also more predictable.
Bitcoin exchange balances plunge
Separate but connected news comes from CryptoQuant, which claims that Bitcoin exchange holdings have fallen to levels last seen at the beginning of 2018.
According to the analytics website, “11% of the circulating supply is currently on exchanges,” a decrease from 17% in March 2020. This pattern would indicate a growing desire for long-term ownership of Bitcoin as opposed to trading it, which would further support the present low-volatility environment.


