
The moving average convergence divergence (MACD) of Bitcoin, the most popular cryptocurrency in the world, has crossed into positive territory, flashing a huge bullish signal. This is the first time this has happened since late 2021.
As Bitcoin’s value soars beyond the $30,000 level for the first time since April 19 owing to the hoopla surrounding a flurry of exchange-traded fund (ETF) registrations from large companies like BlackRock and Invesco, this important momentum indicator may be predicting an impending rally.
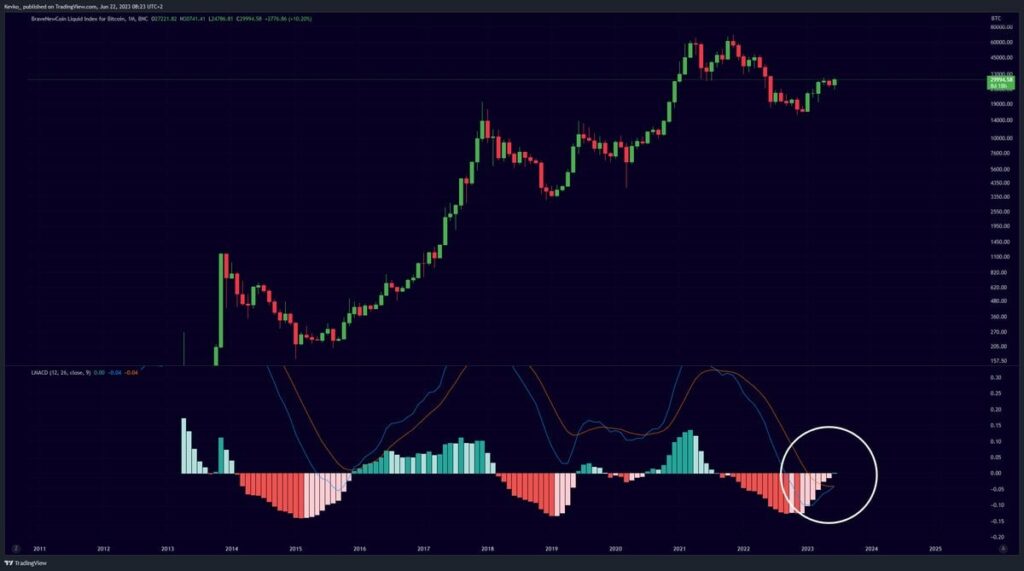
The MACD, a crucial trading tool, is a momentum trend-following indicator that shows the relationship between two moving averages of the price of an asset. The MACD line and the signal line make up the MACD. The 12-period exponential moving average (EMA) is subtracted from the 26-period EMA to produce the MACD line, and the signal line is the MACD line’s 9-day EMA.
An indication that it could be a good idea to buy is given when the MACD line crosses above the signal line. This is known as a bullish signal. The MACD line crossing below the signal line, on the other hand, indicates a bearish indication and may be a good opportunity to sell.
The recent MACD crossover into bullish zone in the case of Bitcoin can be seen as a sign of probable upward price momentum in the short term. To confirm signals and prevent false positives, it should be used in conjunction with other indicators and analytical methods, as with any trading indicators.
At the time of writing, the price of one bitcoin is $30,115.


