
One of oldest indicators in industry shows that bounce is coming
One of the most popular and time-tested indicators in technical analysis, the Relative Strength Index, is showing many signs of an upcoming rebound for Bitcoin as the premier cryptocurrency trades around extremely low values over the past few months.
The two-week chart of the cryptocurrency allows us to see the 11-year-old RSI channel, which has been tested at least four times and acted as an accurate tool for determining local reversal points.
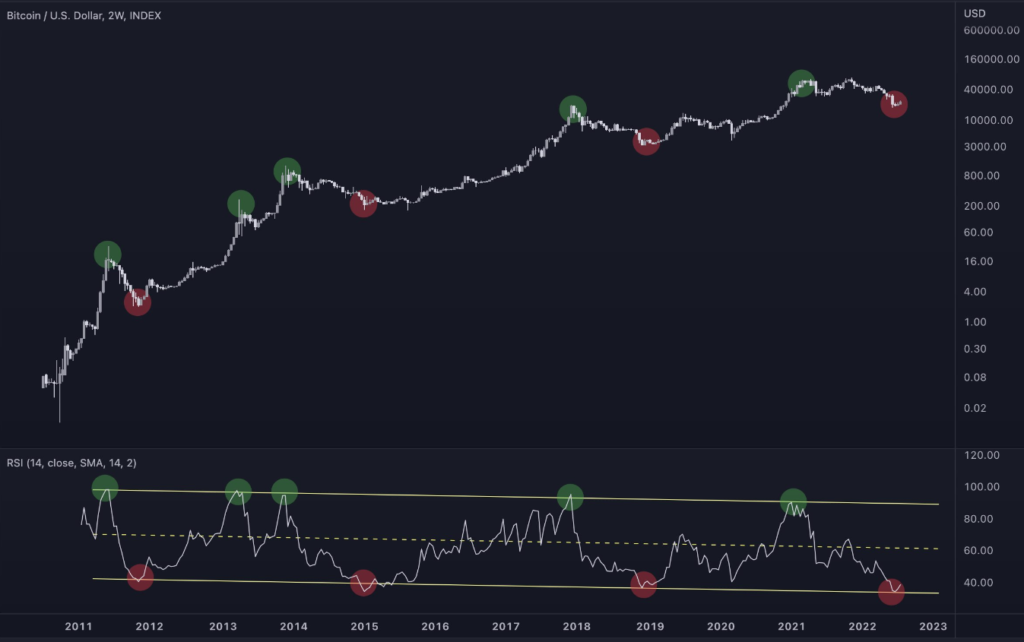
Thanks to the channel, in 2019 we saw the start of the biggest uptrend in the market when BTC hit its current ATH of $69,000. The channel also worked in the opposite direction, allowing us to see almost the exact point of the reversal and the end of the uptrend.
The Relative Strength Index is a tool that helps investors to determine when an asset is overbought or oversold by comparing the price movement with various moving averages. By determining an asset’s state, investors can adjust their position entries and set targets accordingly.
Can RSI be trusted today?
The indicator remains one of the most accurate tools in technical analysis, considering that it successfully determined the most recent reversal in the market. Unfortunately, the fact that Bitcoin will bounce around this price does not necessarily mean that we will see a complete reversal.
RSI only signals that the asset is heavily overbought or oversold, which means that it might start moving in the opposite direction, but it does not mean that it will become overbought at some point.
As for today, Bitcoin is showing signs of a short-term bounce on one side and a lack of trading volume and consistent inflows on the other.


