
Ethereum [ETH] insisted on its sideways momentum while its market consolidated over the last month. Post the bearish flag breakdown, buyers have not been able to break the bonds of the daily 20 EMA (red) resistance.
Additionally, trendline resistance (white, dotted) has kept the alt highs under bearish control for over three months.
Should the current candlestick see a robust close below the $1,045 support, ETH could eye an extended downside in the coming sessions. Any rebound from this level would likely continue the squeeze phase before an explosive break. At press time, the alt was trading at $1,222.5, up by 3.47% in the last 24 hours.
ETH Daily Chart
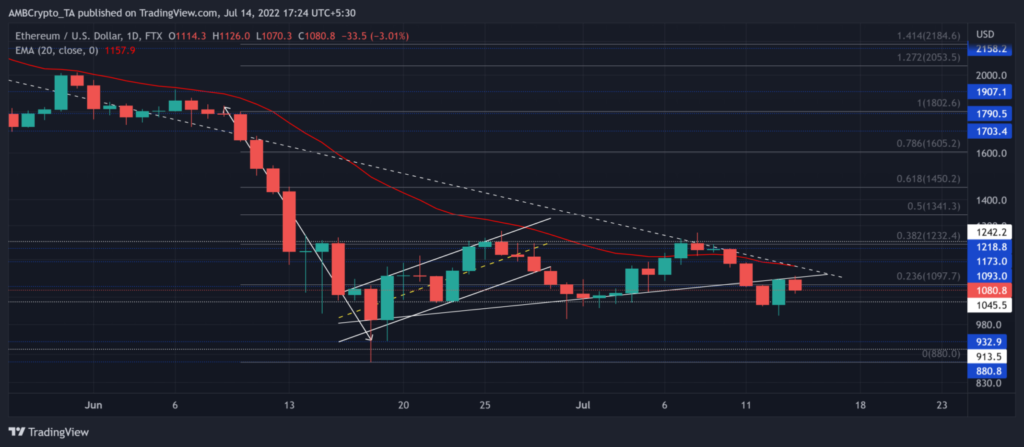
ETH’s long-term trendline resistance has reliably refuted buying efforts by keeping them under tight control for more than three months. Additionally, the 20 EMA (red) held its resistance and showed a bearish influence.
The coin lost nearly 70% of its value over the last few months (since early May). As a result, the alt gravitated toward its 17-month low on 18 June. Since then, the king alt has been consolidating in the $1,232-$1,045 range.
Should the 23.6% resistance cause further selling pressure, ETH could see a pullback towards its immediate support. However, any close below the $1,045 support could extend the selling spree into the next few days. In this case, potential targets would be in the $990 area.
Should the immediate support uphold a buying signal in the investors’ minds, ETH could retest the 38.2% level after a bounce back.
Reasoning
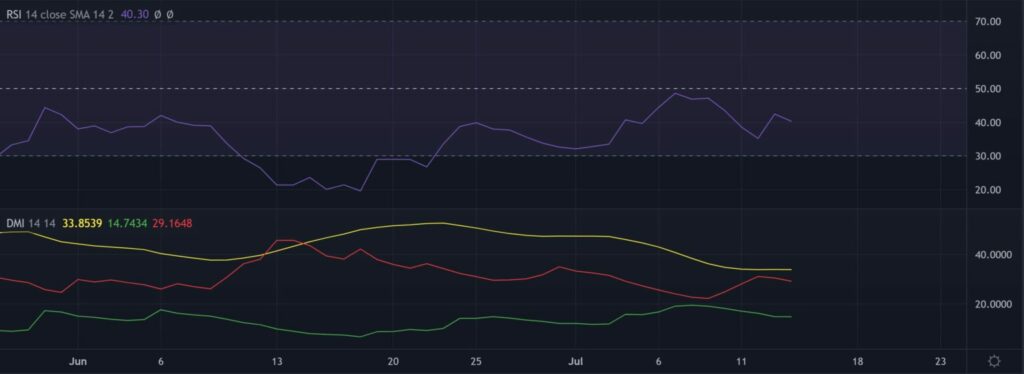
The Relative Strength Index still had to cross the middle line while depicting a relatively bearish edge. Its inability to find a close above the 50 mark could encourage ongoing declines on the chart. Traders should watch for a rally towards the midline, to identify the chances of a bearish invalidation.
Further, the DMI lines continued to exhibit a strong selling advantage with a strong directional trend for ETH.
Conclusion
Buyers needed to enter the $1,045 area to avoid a prolonged drop in the days ahead. Potential buy/sell targets would remain the same as described above.
Finally, investors/traders need to watch out for Bitcoin’s movement. This is because ETH shares a staggering 87% 30-day correlation with the king coin.


