
The 38.2% Fibonacci resistance has significantly impaired the buying efforts over the last three weeks. Over the last few days, Ethereum [ETH] saw an expected breakdown from its bearish flag pattern. Also, the trendline resistance (white, dashed) has kept the alt’s peaks under bearish control for over three months.
If the current candlestick experiences a robust close below the 38.2% level, ETH might be looking at further declines in the coming sessions. At press time, the alt was trading at $1,222.5, up 3.47% in the past 24 hours.
ETH Daily Chart
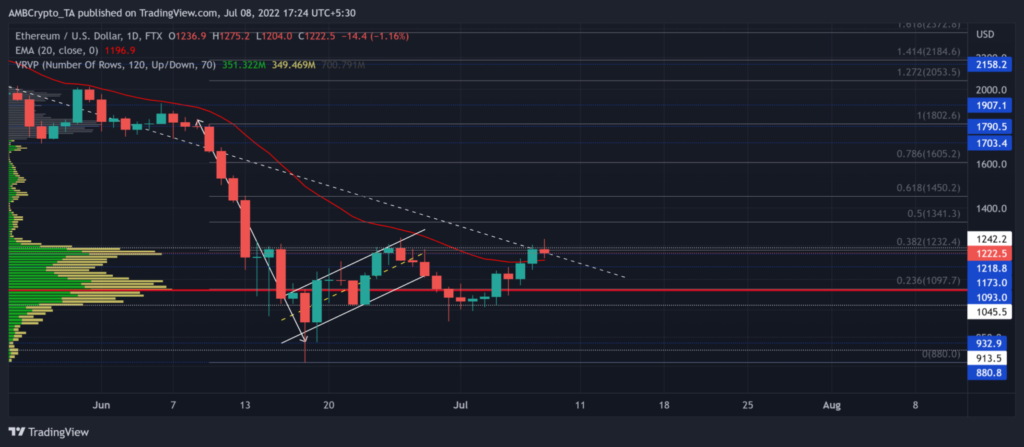
ETH’s three-month trendline resistance delineated a steep drop in the daily time frame. To top it off, the 20 EMA (red) has undermined most bullish recovery efforts until recently.
The breakdown from the $2,700 zone has aggravated the selling power whilst the bulls strived to hold the $1,000-mark support. ETH lost nearly 70% of its value over the last few months (since early May). As a result, the alt gravitated toward its 17-month low on 18 June.
Should the 38.2% resistance inflict selling pressure, ETH may see a pullback towards the point of control (POC, red). In this case, potential short sell targets would be near the $1,045 support.
Also, with the trendline resistance standing sturdy, the buyers could face a tough time overturning the $1,200 zone. A decline below the 20 EMA would expose ETH to a potential downside. Any bearish invalidations could aid the buyers in provoking a rather short-lived rally until the 50.2% level.
Reasoning
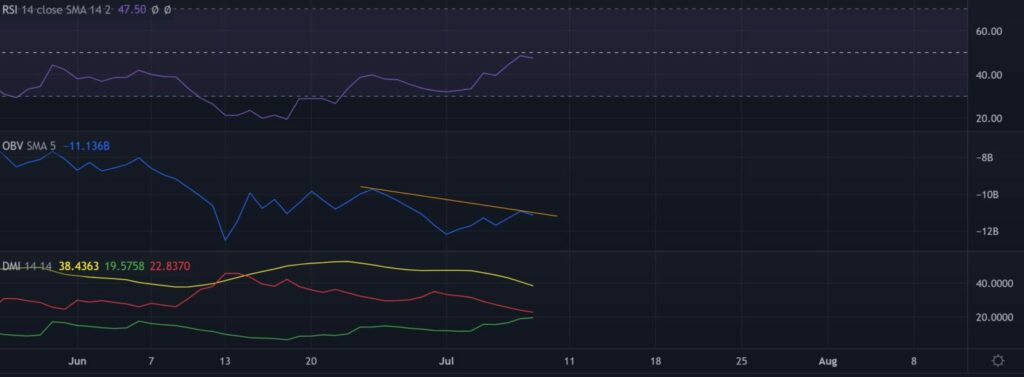
The Relative Strength Index (RSI) had yet to break above the midline while posting a relatively neutral stance. Its inability to find a close above the 50 mark could encourage ongoing declines on the chart. Traders should watch for a close above the middle line to confirm higher chances of a bearish invalidation.
Further, the On-Balance Volume (OBV) saw lower peaks and revealed a slight decrease in the buying pressure over the last two weeks. Finally, any bullish crossover on the Directional Movement Index (DMI) could be detrimental for the short-sellers.
Conclusion
Bulls needed to increase buying volumes near the 20 EMA to avoid downside risk of nearly 14%. Traders/Investors should beware of the warnings set forth by the indicators as stated above.
Also, investors/traders need to watch out for Bitcoin’s movement. This is because ETH shares a whopping 98% 30-day correlation with the king coin.


