
SHIB has been consolidating inside a triangle pattern
Shiba Inu has been stuck in a sideways trading range below the $0.0000324 level since March. According to daily Shiba Inu charts, SHIB has consolidated inside a triangle pattern. As the price looks set for a price move entering the triangle formation, momentum indicators, especially the RSI, are hovering near the neutral 50 mark.
This suggests that Shiba Inu might continue its consolidation phase inside the triangle for a while before a possible price breakout. The SHIB price stalled shortly after reaching all-time highs of $0.000088 in October 2021. At a present price of $0.0000233, SHIB remains down nearly 73.48% from its ATH.
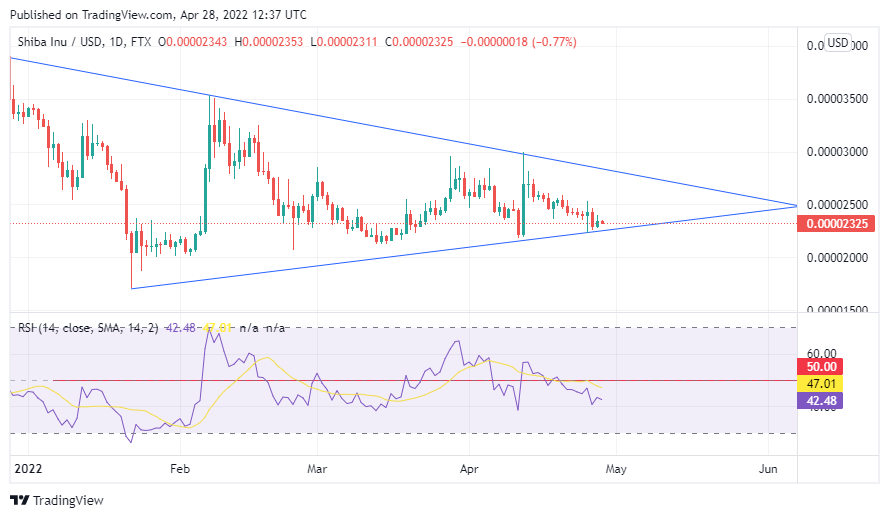
Going forward, one of two things could happen: a break above the current trading range could trigger an 18% upside to recent highs at $0.0000353. Further upside moves may aim for targets at $0.0000543 and $0.000065. Alternatively, a retest of the demand zone could look for support between $0.000020 and $0.000017.
Indicators reveal this
The net network growth indicator provided by IntoTheBlock gives a view of both user engagement and growth. In this regard, Shiba Inu ticks into negative territory. Shortly after peaking at 1,199,453 in mid-March, the Shiba Inu holder count has declined to stand at 1,139,916 at press time.
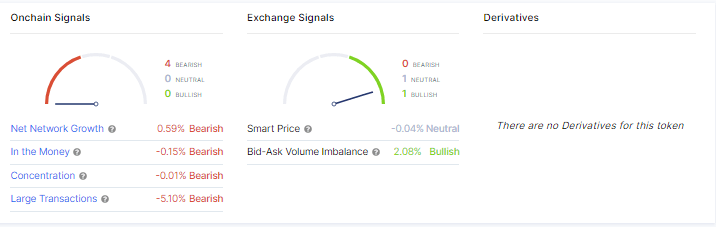
The latest price increase in April also failed to adequately impact the holder count. Amid this, whales are less active, as seen in a 10% drop in active Shiba Inu whale addresses as indicated by WhaleStats.
Analysts frequently note that a price hike coupled with a reduction in network commitments or a reduction in the number of users on the network could indicate something.
This could indicate that holders are quite relaxed and are not shifting coins because they believe prices might rise. As a result, they “hodl” their assets, reducing their activity. Per WhaleStats data, Shiba Inu remains the biggest token holding for the top ETH whales.


