
Veteran trader sees similarities between 2019’s and today’s Bitcoin chart
Following Bitcoin’s breakout and subsequent surge to $47,000, various crypto market analysts including veteran trader Peter Brandt, expressed their thoughts and analysis regarding the potential future movement of the first cryptocurrency.
Bitcoin spikes to $47,000
According to the provided chart and a pattern, Brandt expects a similar price movement for Bitcoin as we saw back when the cryptocurrency was trading around $4,000 and $8,000. Back then, BTC had a similar breakout from the symmetrical rangebound.
After the 2019 breakout, Bitcoin entered the upside range after gaining around 20%, which resulted in another breakout that took digital gold to new local highs. The subsequent pump resulted in a 50% price increase.
Despite showing quite similar historical movements, the veteran trader offered a disclaimer, warning the community that charts cannot predict the future. The provided charts and strategies are useful only within trading programs and strategies that require proper risk management.
He added that if the $BTC cash tag “freezes and the laser eyes reappear,” traders should be careful. The warning most likely refers to the greed phase in the market when the community around the market becomes extremely bullish. Here, the probability of a long press and a sudden crash increases exponentially.
Bitcoin market performance
According to the chart by TradingView, Bitcoin has successfully broken through the resistance line of an ascending rangebound and now consolidates at around $47,000. The day’s high is at $47,800.
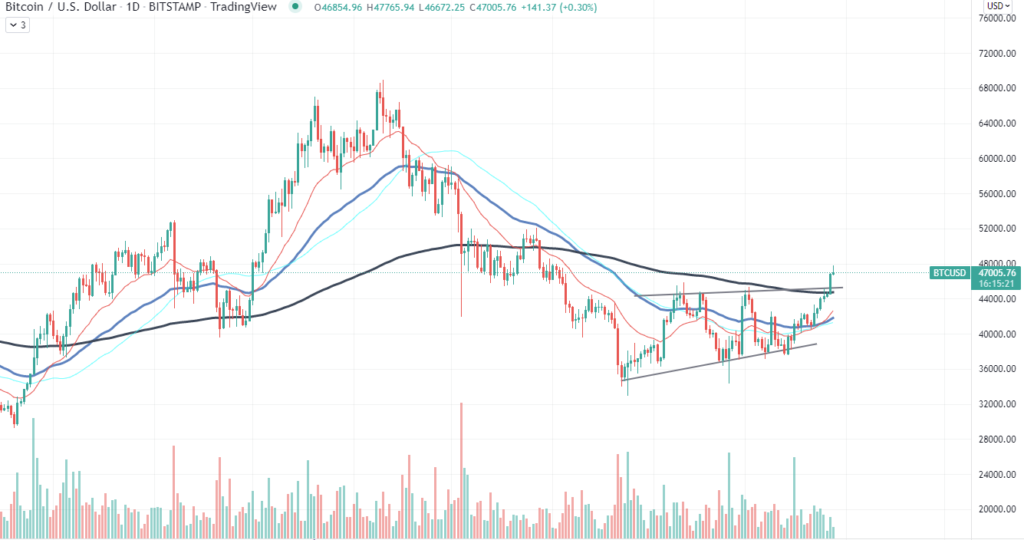
In addition to breaching the boundary, BTC also crossed a 200-day exponential moving average, which has acted as strong resistance since December 2021. At press time, Bitcoin is trading at exactly $47,000.


