Here’s what Bitcoin’s chart movements tell us
According to Blockware Chief Analyst Will Clemente, Bitcoin remains in an upward consolidation pattern over the past two months, showing that the market is still uncertain about which direction to take and is waiting for additional signals.
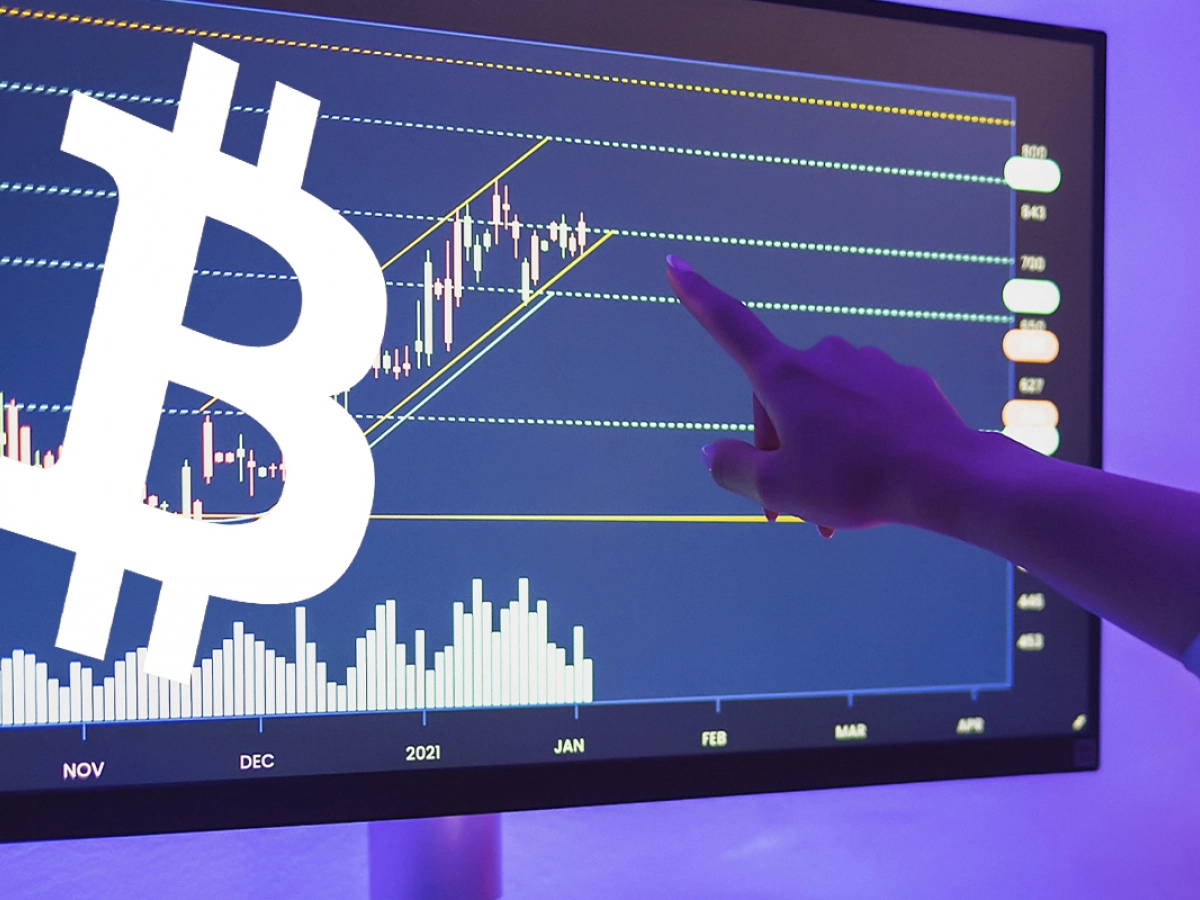
How Bitcoin moves in the last two months
As the provided chart suggests, the first cryptocurrency moves in the rangebound formed since the beginning of February, when the first cryptocurrency was trading at approximately $45,000. After the retrace, BTC hit the local bottom of $37,000 and then went for another run.
On the next text, the bulls were again unable to breach the upper boundary of the range pattern, and digital gold plunged again to $38,623. The number of failed attempts to break through resistance could indicate a lack of buying power coming from both retail and institutional investors in the market.
The main reason Bitcoin is still below $50,000
Fear and uncertainty are two key drivers of the current market. Because of a lack of signals and risk-off on the crypto and financial markets, large Bitcoin investors, or institutions, are not pouring any liquidity into the market, which is necessary for swings like we saw back in February.
According to Bitcoin balance on exchange metrics, traders actively withdraw funds from centralized exchanges and hold them in private wallets. A large exit rate suggests that liquidity in the crypto market is slowly decreasing.
At press time, the first cryptocurrency trades at $39,000. The most notable event this week will be the FED’s rate hike, expected by the market since the beginning of 2022. Previously, U.Today covered what the crypto market may or may not expect this week.


