After bitcoin’s move towards $45,000 turned into a fakeout as BTC was heavily rejected, the recent price action turned short-term bearish, with a critical level to watch at $40,000.
The uncertainty and the low liquidity status in the crypto markets have led to a volatile period that is also highly correlated with the global markets. Fundamentals such as the Ukraine – Russia conflict affect both global and the crypto markets.
After two disappointing weekly candles, Bitcoin is eyeing the close of this week’s candle at what could become a critical moment should it close below critical support.
Technical Analysis
Long-Term
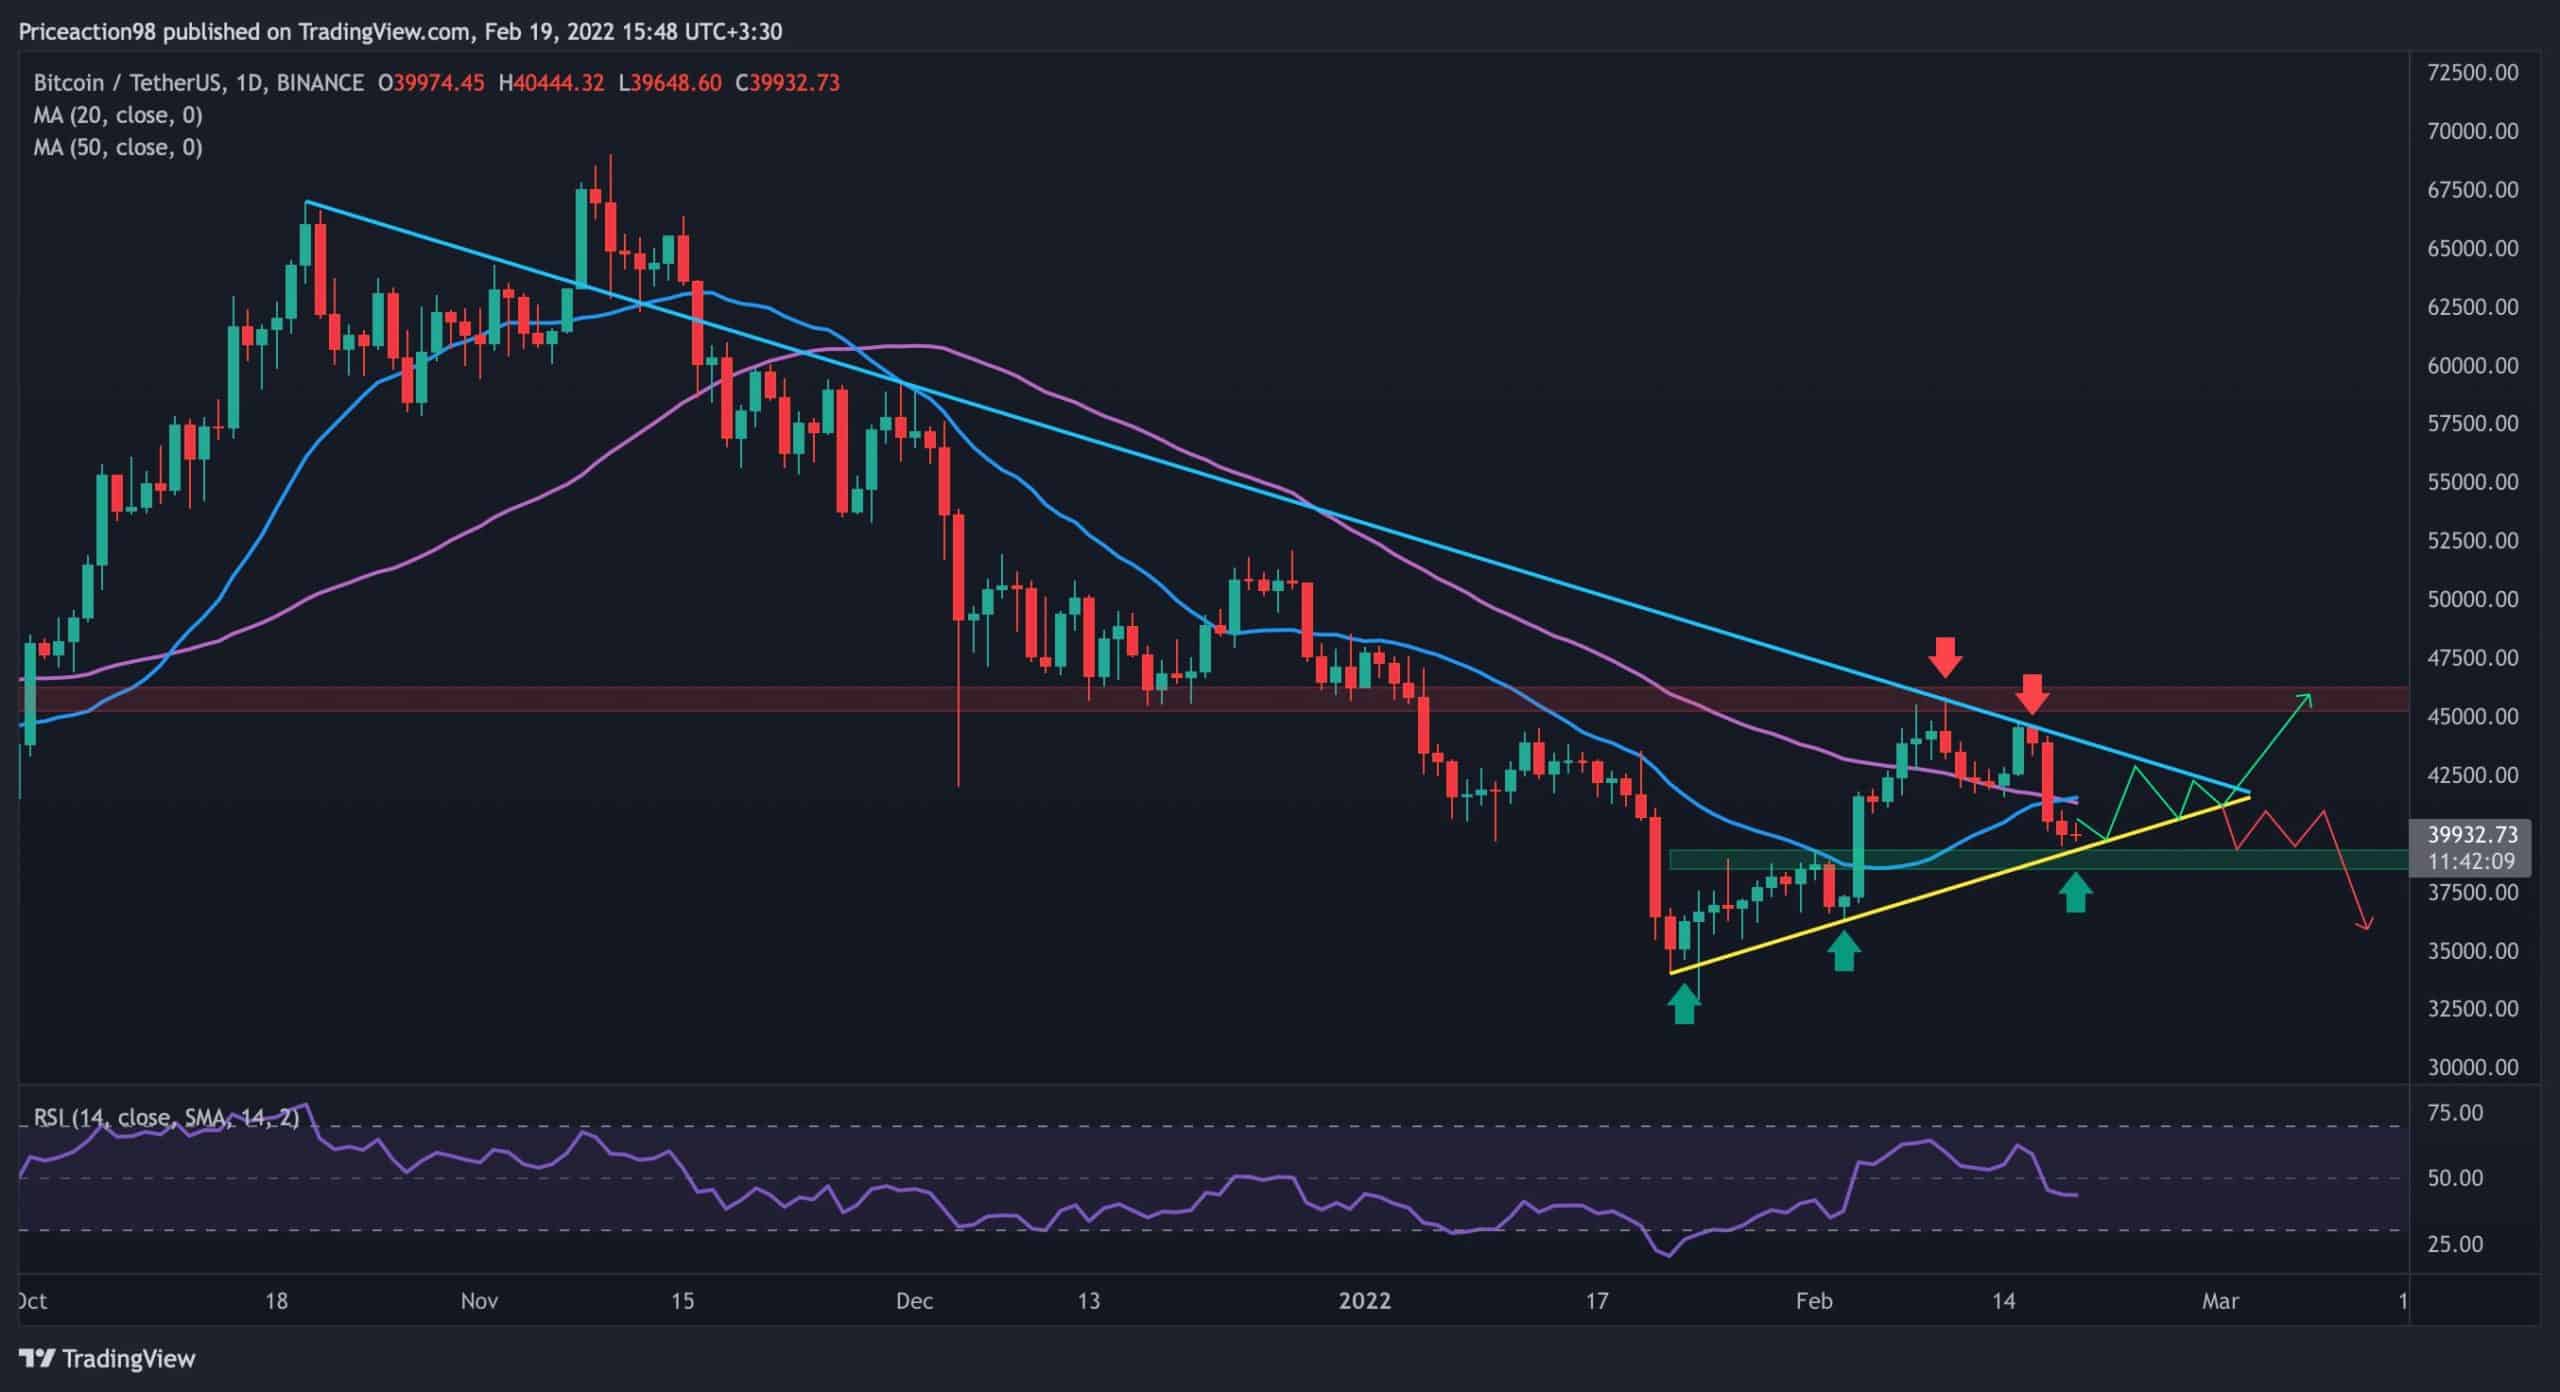
The bitcoin price was rejected at the multi-month resistance descending trendline (marked blue on the following chart).
On Thursday, February 17, bitcoin fell below the critical moving averages – 50 and 20 day MA – showing that the bears are not about to give up and are selling during the rallies to exit the market.
In addition, the price failed to form a higher high on the daily time frame, which was essential for a reversal scenario. BTC is currently trading above the $38-39K support, along with the ascending yellow trendline, hence, we can expect two possible scenarios from here:
- Bullish: BTC is consolidating around the $40,000 area and breaking above the blue trendline. If the price bounces off the current level, the bulls must push the price above the 20 and 50 day moving averages. In this case, we can expect a break above last week’s high at $45.8,000.
- Bearish: BTC will fall below the yellow trendline and support zone, heading for lower levels. Given the RSI values, there is plenty of room for bitcoin to drop and form a new local low, which will also create a lower low (bearish trajectory).

Short-Term
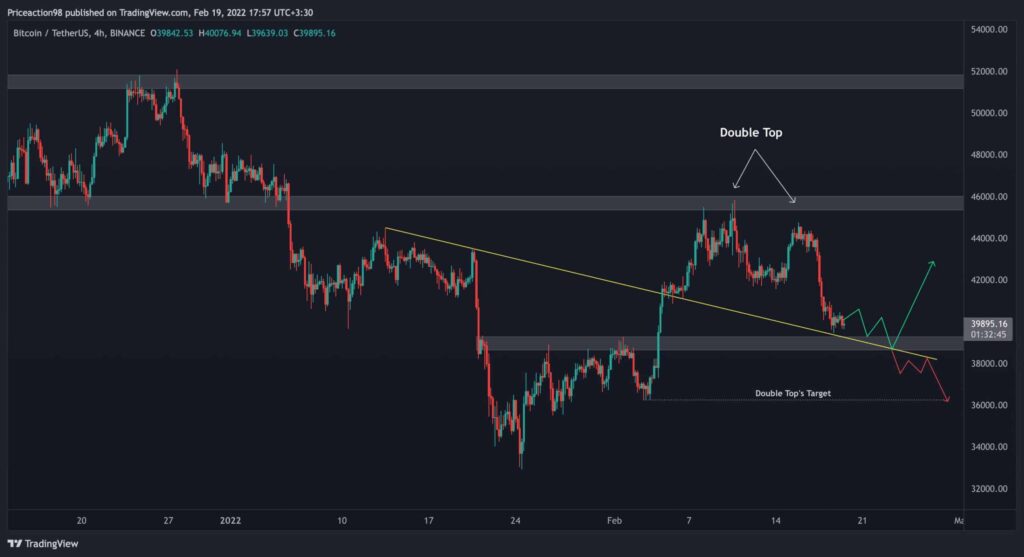
The bitcoin price has dipped since forming a double top pattern on the 4-hour time frame (shown below). As mentioned above, the price is still trading above the support zone of $38K-$39.2K, as well as the ascending trendline (the yellow line).
A likely scenario is a break below the mentioned support and then a drop in price levels, confirming the “Double Top” pattern. However, on the other hand, if the current support holds, Bitcoin is likely to retest the $45,000 area.
Futures Market Analysis
The recent significant surge towards $45K has re-established optimism across the market. The consequencing FOMO led many speculators to enter high-leverage long positions.
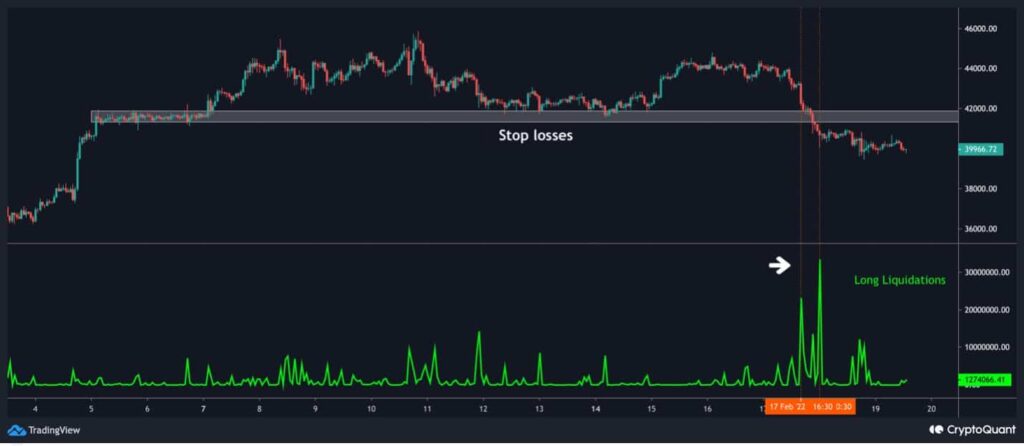
Then the price was again rejected at the $45,000 level and saw a rapid decline of 12% in the previous three days. This led to another cascade of lengthy liquidations.
In addition to the massive liquidations event, based on price action patterns, many technical analysts identified the $41K – $42K zone as support, meaning that many stop losses were set below this level. As a result, when BTC fell below this level, a wave of stop losses was triggered, intensifying the bearish trend.