After a bloody week, the price of bitcoin is slowly recovering, following a 50% decline since recording the $69,000 ATH level in November 2021. The following analysis will discuss two possible scenarios for the future, from a technical point of view.
Technica Analysis
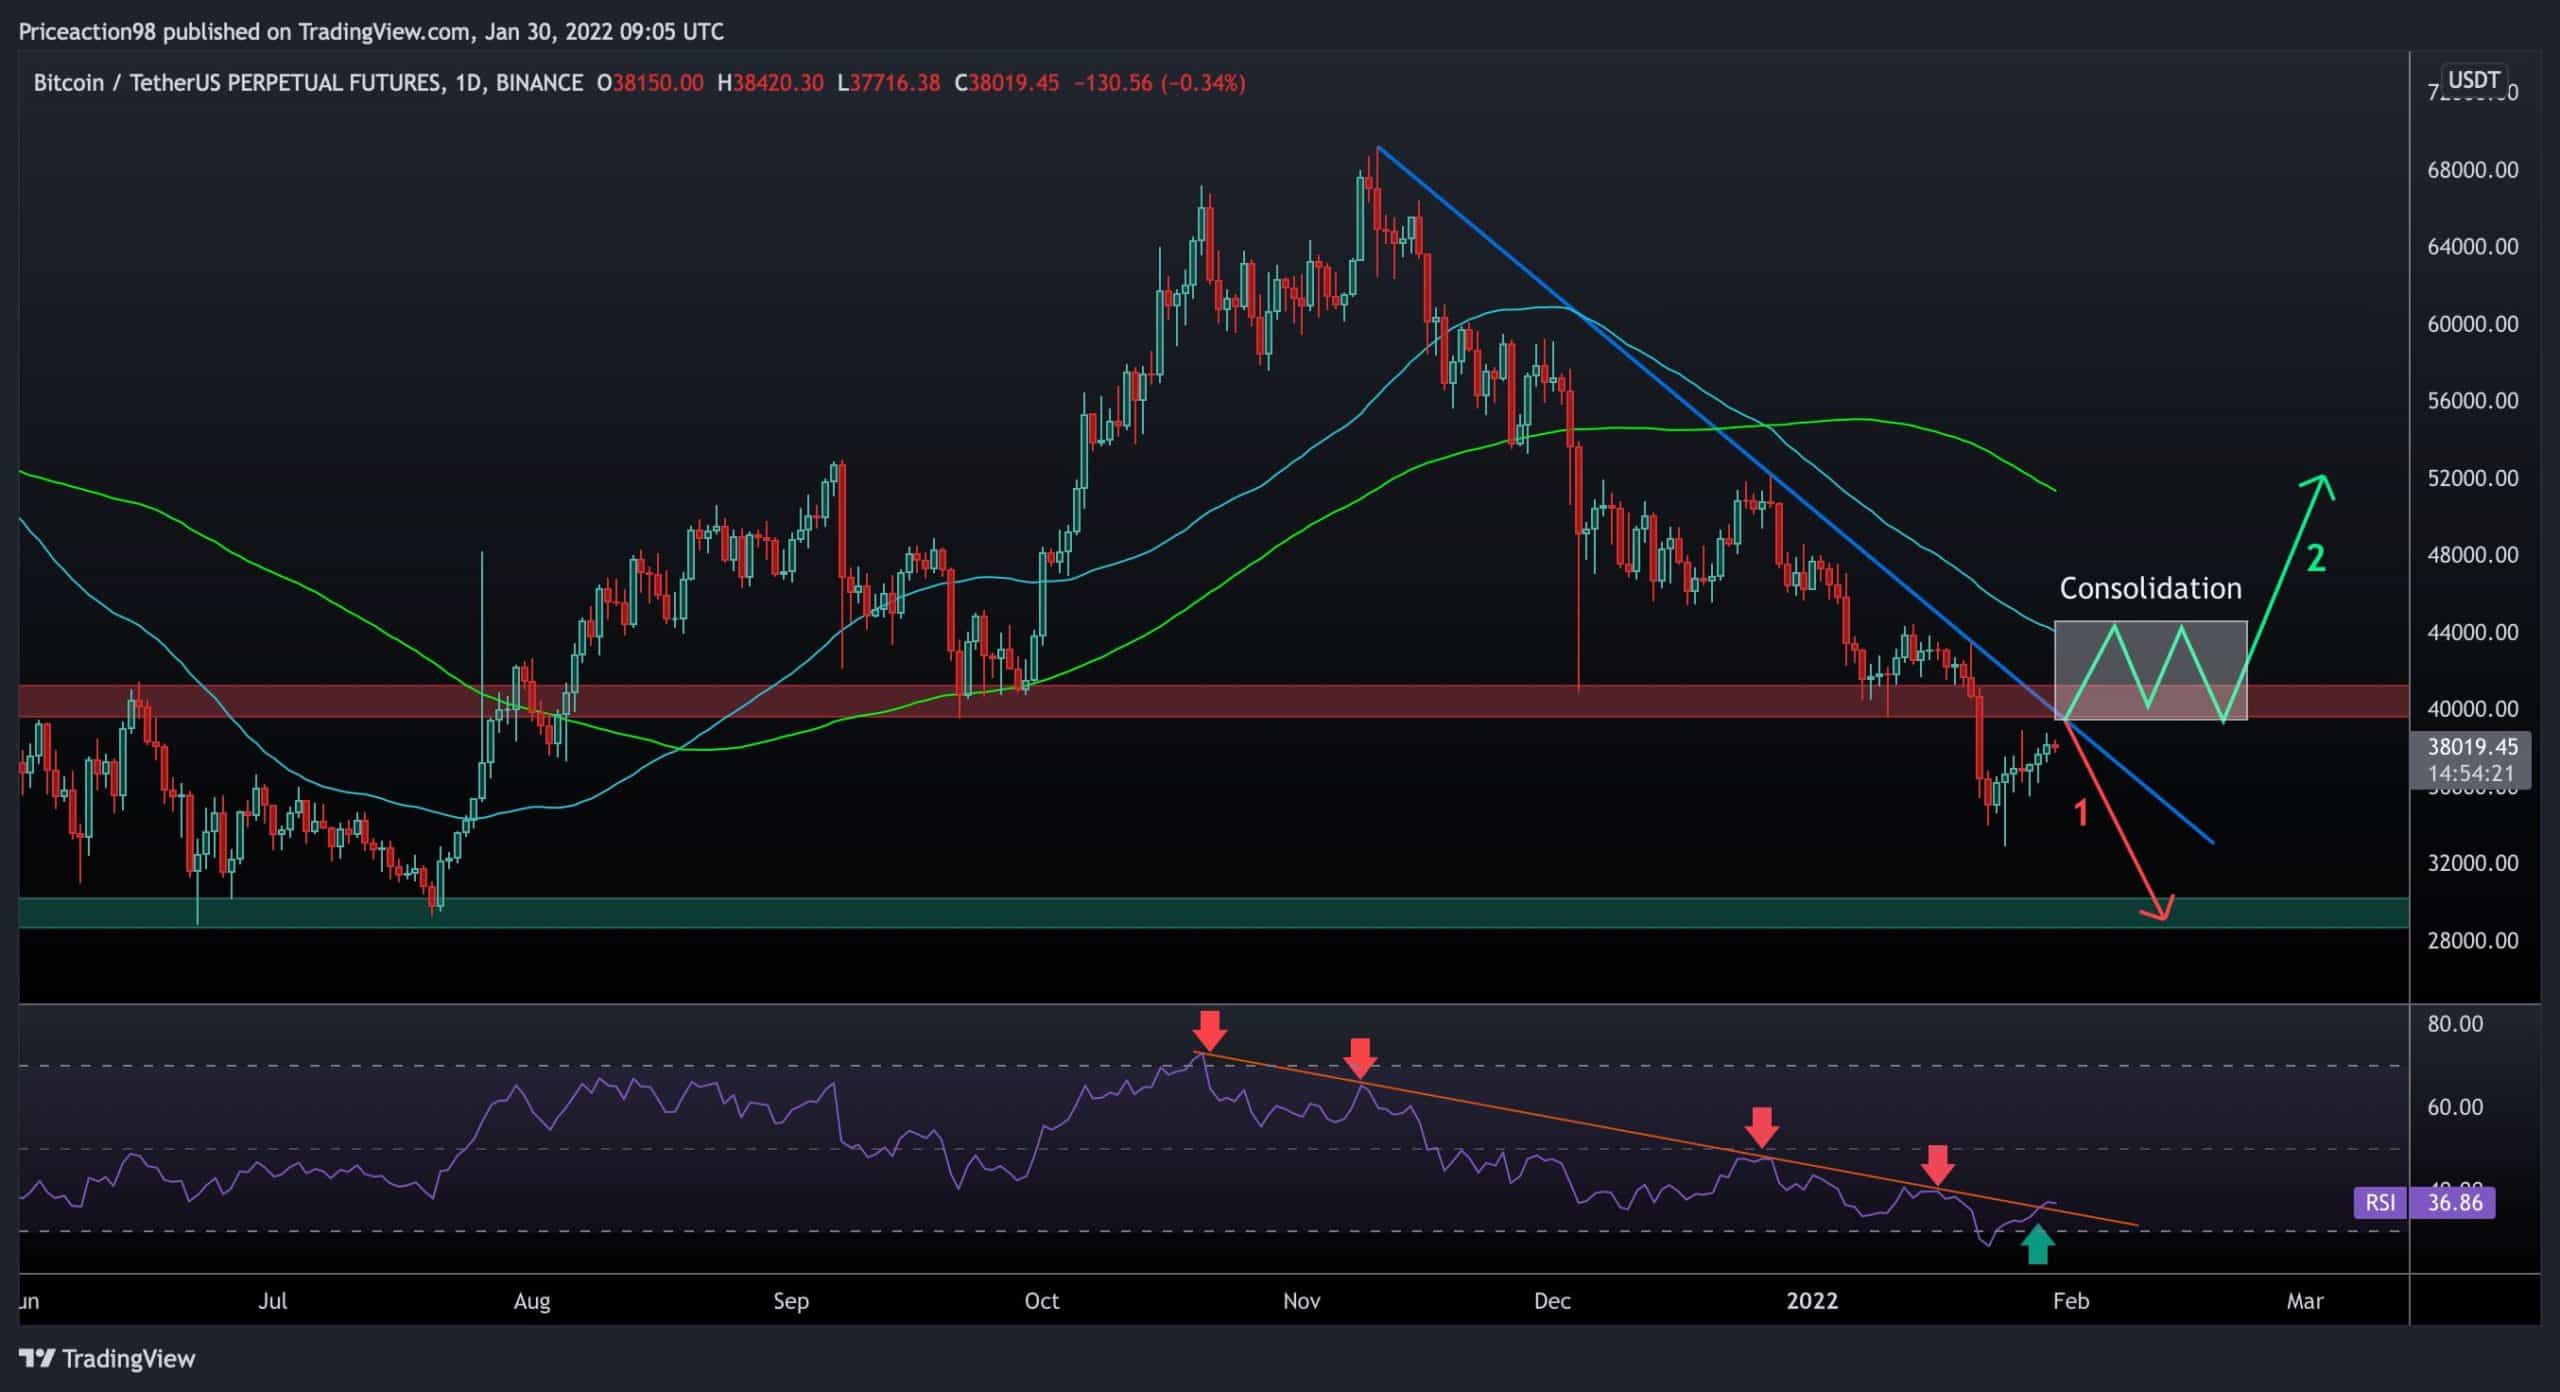
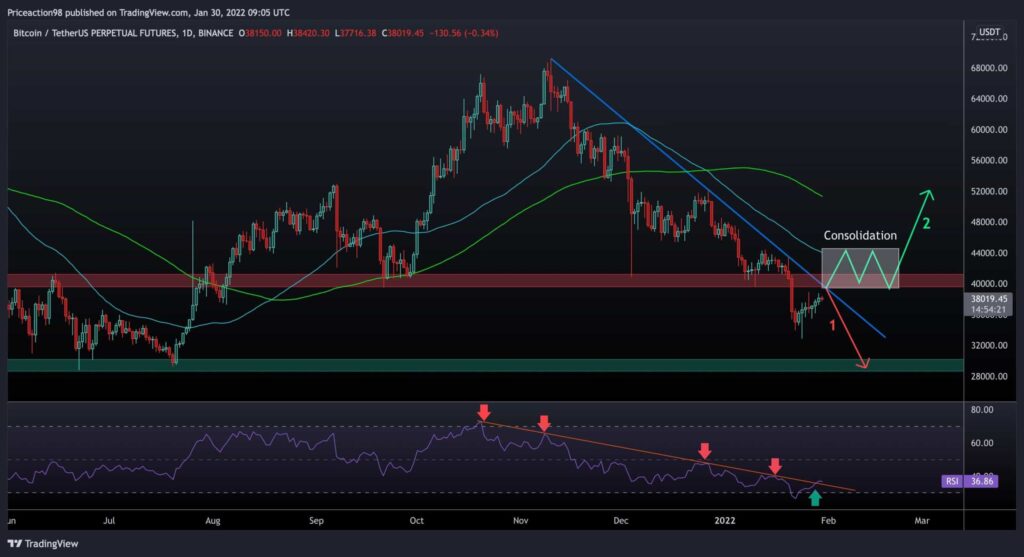
Long-Time Frame: The Daily
Looking at the daily chart, the BTC price has been recovering since it plunged over 50%, plunging below $33K last Monday.
However, Bitcoin is still under two critical resistance zones right now. The first is the blue downtrend line driving the price down whenever BTC has attempted to break above it, and the second area is the red marked range between $39,000 and $41,000.
On the other hand, the daily RSI has broken out of the multi-month low sloping resistance. The two previous breakouts had led to huge bullish moves over the past year.
In conclusion, the two likely scenarios are:
- Breaking above the descending trendline and the red area (around the $40K zone), consolidate above the zone for a while, generate a pullback to the resistance, and begin a price rally into the $50-60K channel.
- Being rejected by both the trend line and the horizontal resistance zone, forming a new lower high to confirm the downtrend, then falling to lower price levels and test support areas to develop a new bottom local.
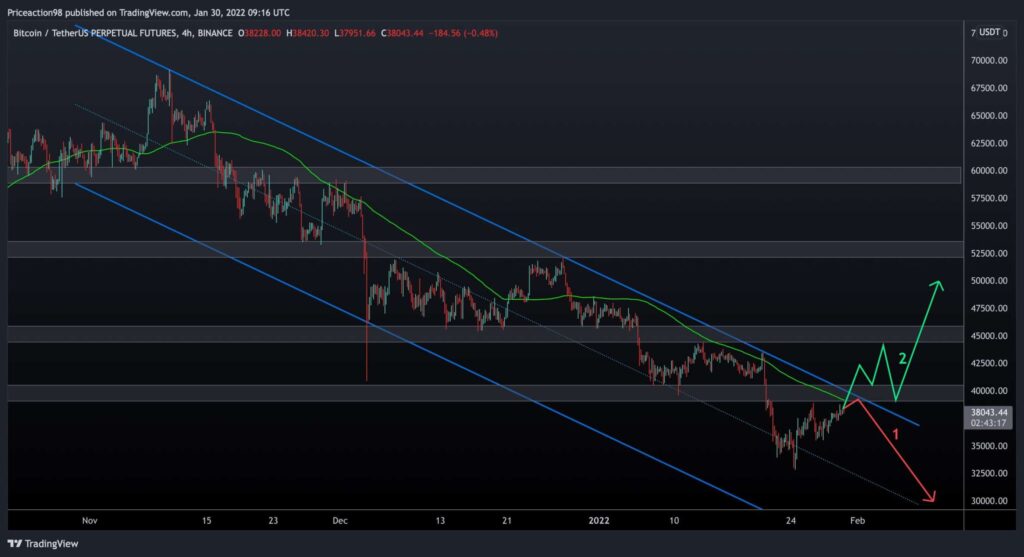
Short-Term Time Frame: The 4-hour
Bitcoin has multiple resistance levels in the lower timeframes (LTF), as indicated in the following chart. The price has created lower highs and lower lows inside a solid bearish descending channel.
The price is now trading below the 100-MA line and the upper trendline of the channel. Accordingly, if the market is about to rebound and start a new bullish rally, it is necessary to break out of the trendline and reach a new high, as shown in the green path.
The other scenario is that the price touches the trendline, records a new lower high, and then gets rejected on its way to retest lower price levels (the red path).
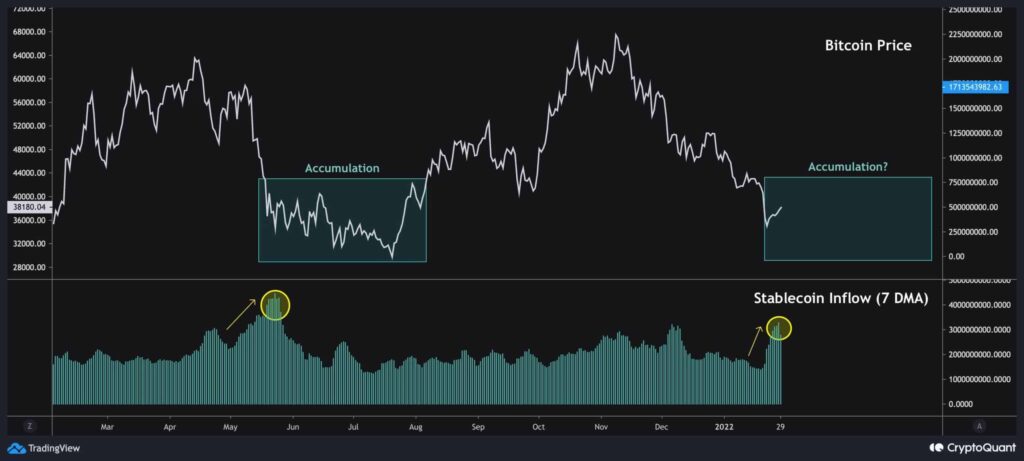
Onchain Analysis: Entry of Stable Coins
The following chart includes the BTC price and the 7-day moving average of stablecoin inflow.
As you can see, there has been a significant rise in the volume of stablecoins deposited into exchanges over the past few days.
The last time we saw such a strong increase in this metric was in May 2021, after the crash at the $30,000 range. This suggests that liquidity is ready to buy the dip. However, the accumulation phases after huge stock market crashes usually take a while. Thus, it may take a few weeks or even months for a price increase to occur, just like last year.