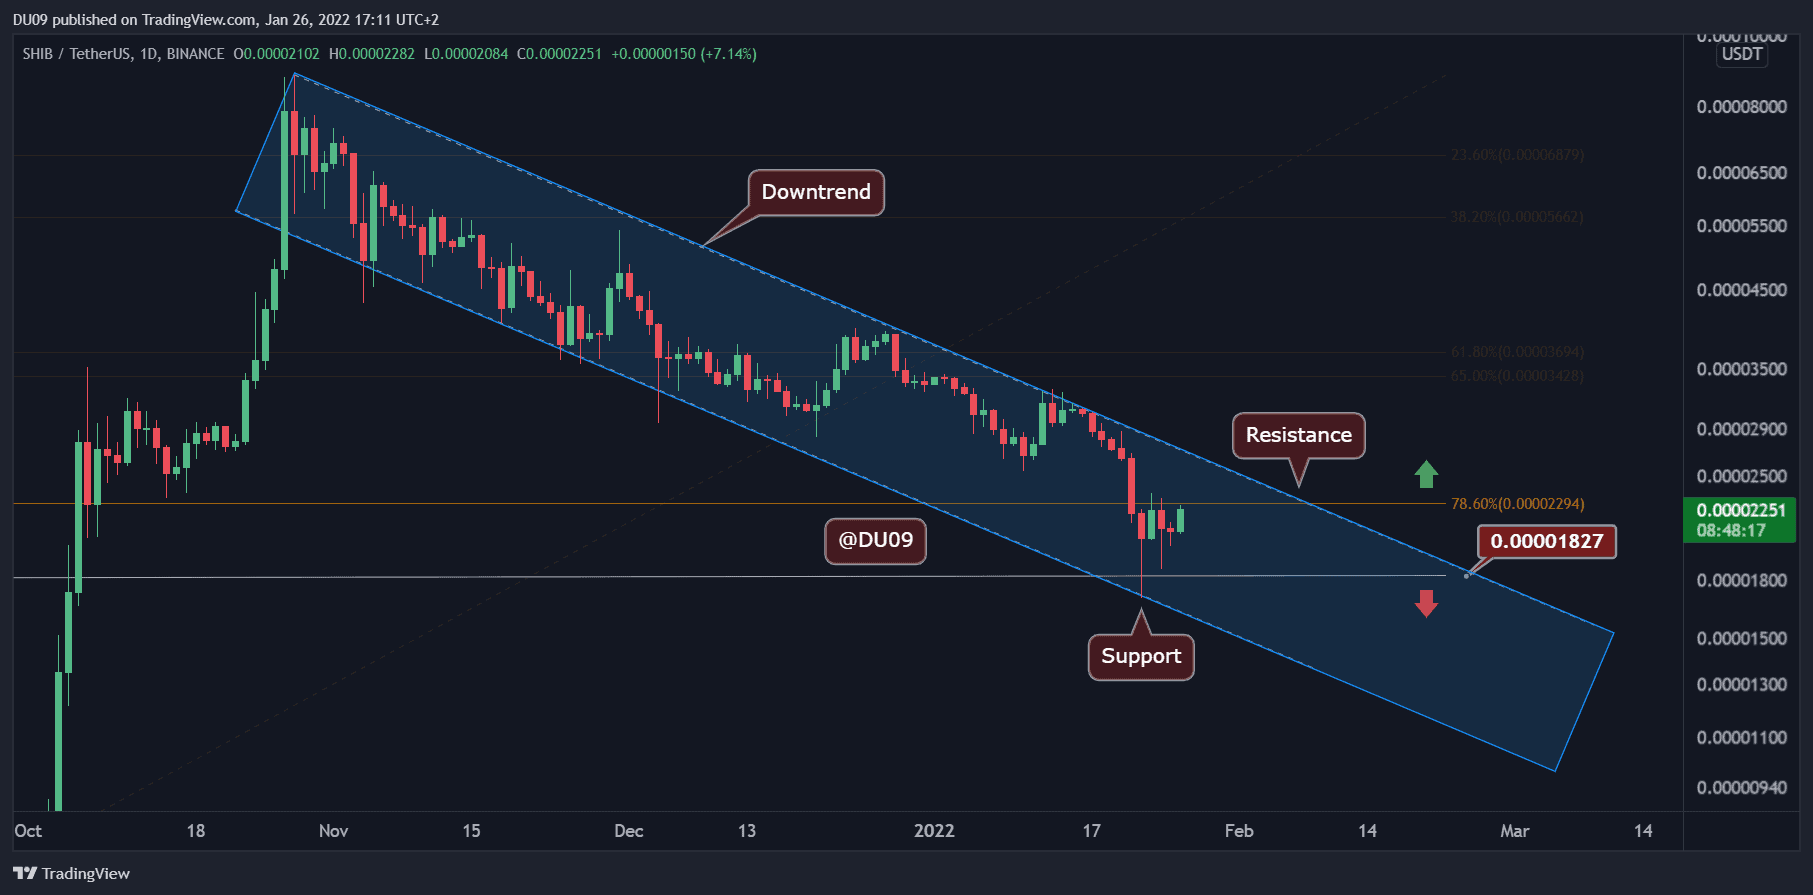
Key Support Level: $0.000018
Key Resistance Level: $0.000023
SHIB’s woes began in October 2021, and since then the price has been in an unbroken downtrend. Whenever there was hope for a reversal, the bears came back stronger. Last Saturday, SHIB made a new low and found support at $0.000018.
The resistance is now found at $0.000023, and bulls are trying to challenge it again after an earlier failure to move SHIB’s price above it.

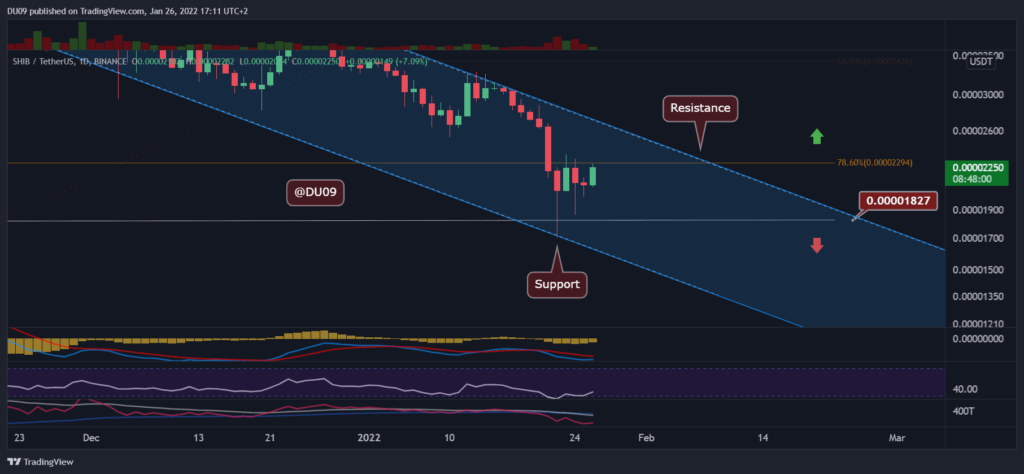
Technical indicators
Trading volume: The volume of this most recent decline was high, comparable only to the December crash. This shows that the sellers have a lot of strength to drive down the SHIB.
RSI: The daily RSI fell in the oversold area for the first time in 2022, from where it bounced up quickly. This is good news for the buyers, but the key resistance seems to put up a fight and is currently blocking SHIB from moving higher.
MACD: The daily MACD remains bearish, but the histogram shows some indication of bullishness with a higher low. Buyers really need to break resistance to turn the tide.
Bias
The bias on SHIB is bearish. This may be revisited if the cryptocurrency breaks the resistance level in question.
Short term prediction for SHIB price
SHIB is just below the key resistance at $0.000023 and doesn’t seem very confident that it can be broken. For this reason, any failure here could push the price back to the support at $0.000018.


