Kava.io (KAVA) has broken down from a long-term pattern and is at risk of breaking down below a crucial horizontal support area. This would have bearish ramifications for the future movement.
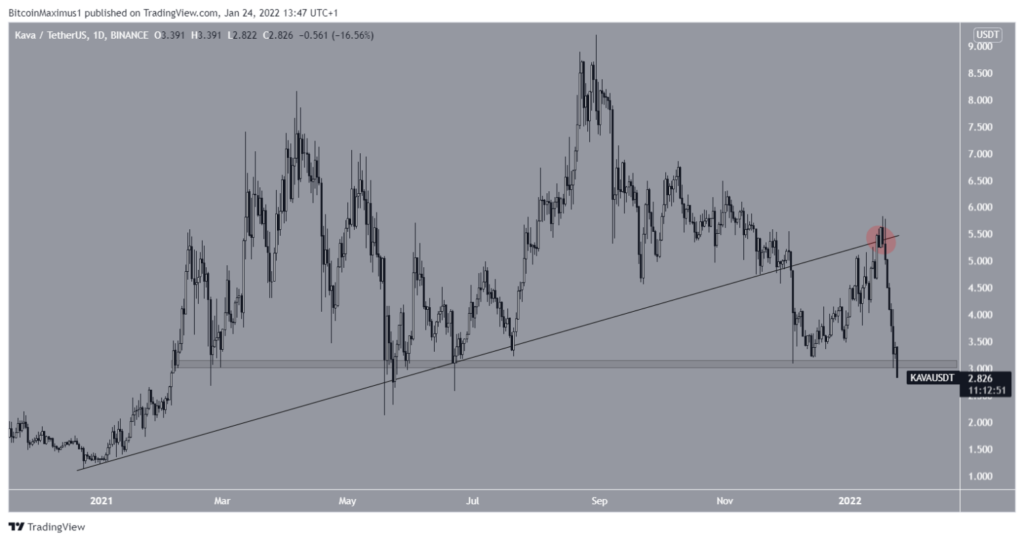
KAVA has been declining since hitting an all-time high of $9.21 on August 30. On December 3, it broke down from an ascending support line that had been in place since the start of the year. Then it rebounded and validated the line as resistance (red circle) on January 18th. The token has been declining ever since.
Currently, it is attempting to hold on above the $3 horizontal area. If it were to break down below it, the next support would be all the way down at $1.40. Therefore, it is crucial that KAVA holds on above this level in order for it to have a chance of moving upwards.
future movement
Trader in cryptocurrency @Mesawine1 tweeted a KAVA chart, indicating that the token has completed an ending diagonal and will drop significantly.
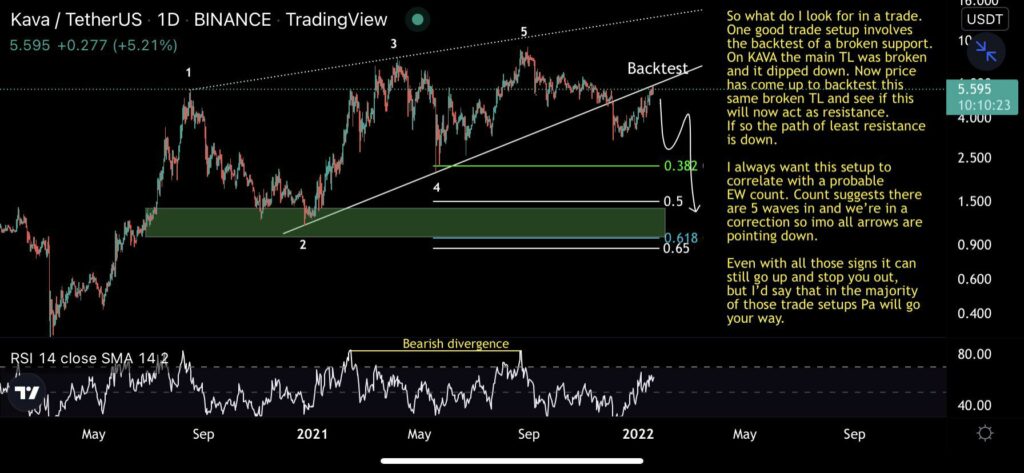
Since the tweet, KAVA has validated the line as resistance and resumed its downward movement. The support line coincides with the one we have outlined.
There was a very significant bearish divergence (green line) in both the RSI and MACD prior to the decline. Such divergences often precede the downtrend reversal, so they support the ongoing decline.
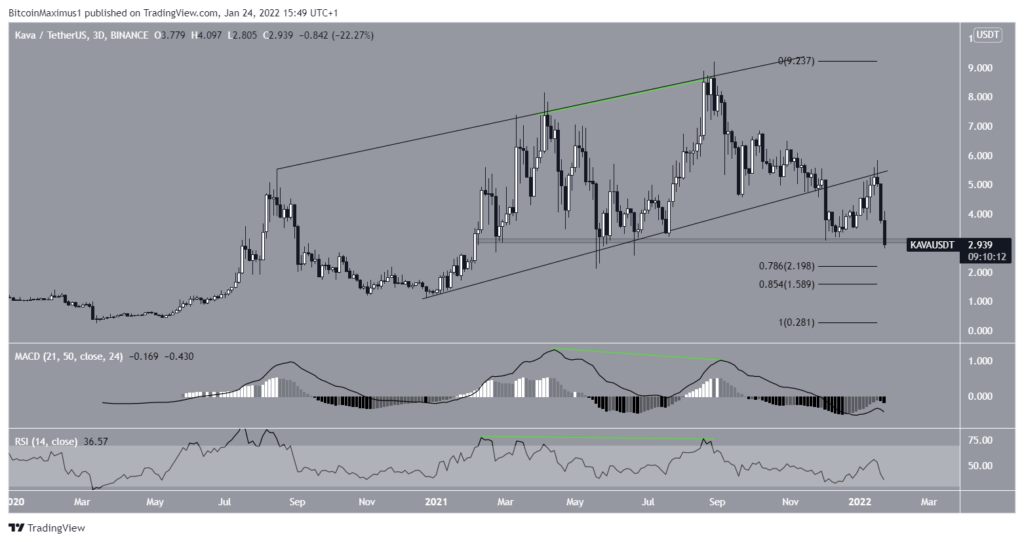
If KAVA breaks down from the current support, the next support would be at $2.20 and $1.60. These are the 0.786 and 0.85 Fib retracement support levels, respectively.
Short Term KAVA Rebound
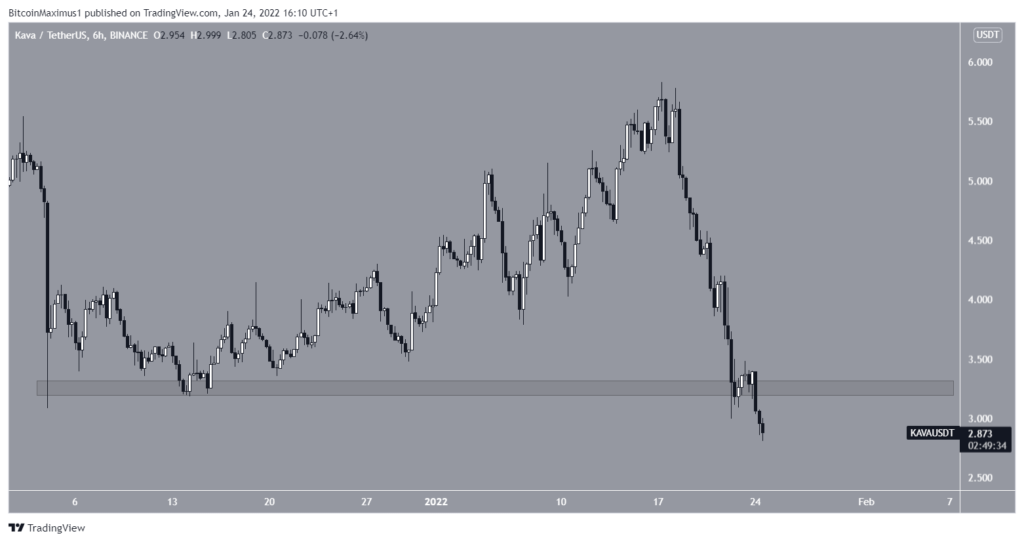
The six-hour chart provides a bearish outlook. Since December 3, KAVA has held above the $3.25 horizontal support zone. More recently, he validated it on January 18, initiating a rebound in the process.
However, the token has fallen below the area since, supporting the possibility that it will continue moving downwards.