FTX Token (FTT) has bounced at a crucial support area and is showing strong signs of a bullish reversal.
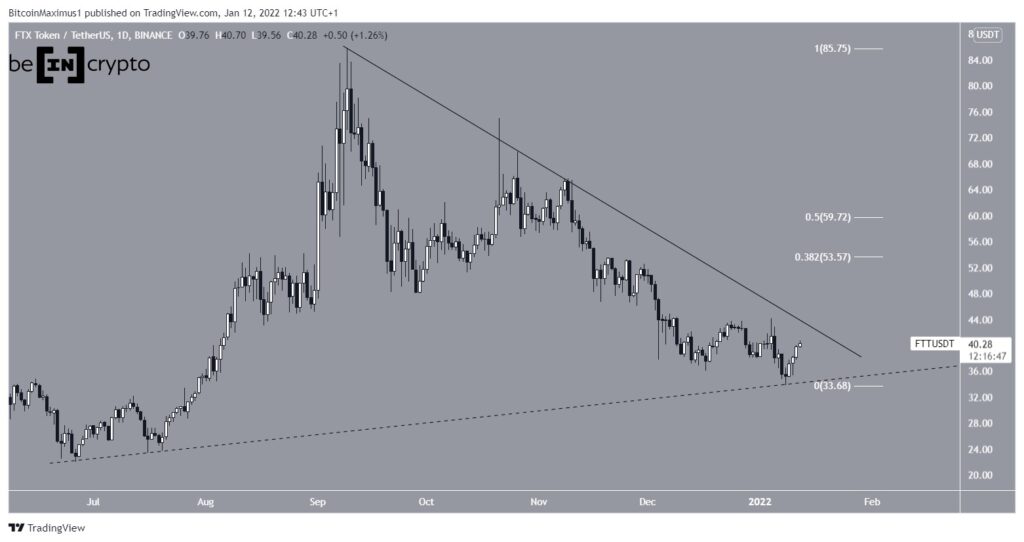
FTT has been declining along a descending resistance line since hitting an all-time high of $85.74 on September 9. The decline led to a low of $33.76 on January 8.
The token bounced afterwards, potentially validating an ascending support line (dashed), that has been in place since June 26. FTT is approaching the resistance line once more.
If a breakout occurs, the nearest resistance would be seen between $53.5 and $59.7. The zone is created by the resistance levels at the 0.382-0.5 Fib retracement.
Future movement
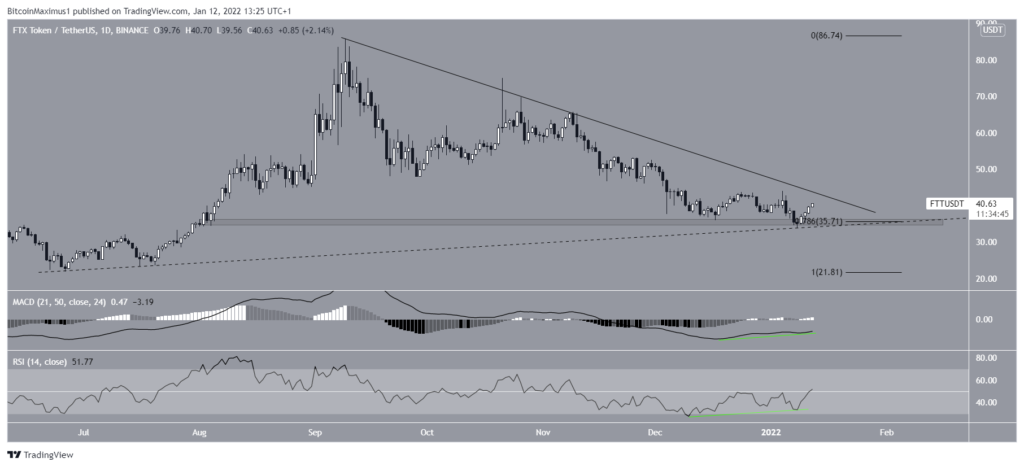
Trader @0xd0n tweeted a FTT chart, stating that the token has bounced at a crucial support level.
The daily chart shows FTT rebounded just at the 0.786 Fib retracement support level at $35.7. It is also a horizontal support zone, which further increases its importance.
Furthermore, technical indicators are decisively bullish.
The MACD, which is created by a short-term and long-term moving average (MA), moves upwards and is almost positive. More importantly, it generated significant bullish divergence (green line), an event that often precedes bullish trend reversals.
The RSI, which is a momentum indicator, has also generated bullish divergence. In addition to this, it has moved above 50, a level which is considered the threshold for a bullish/bearish trend.
Therefore, a possible breakout of the resistance line seems likely.
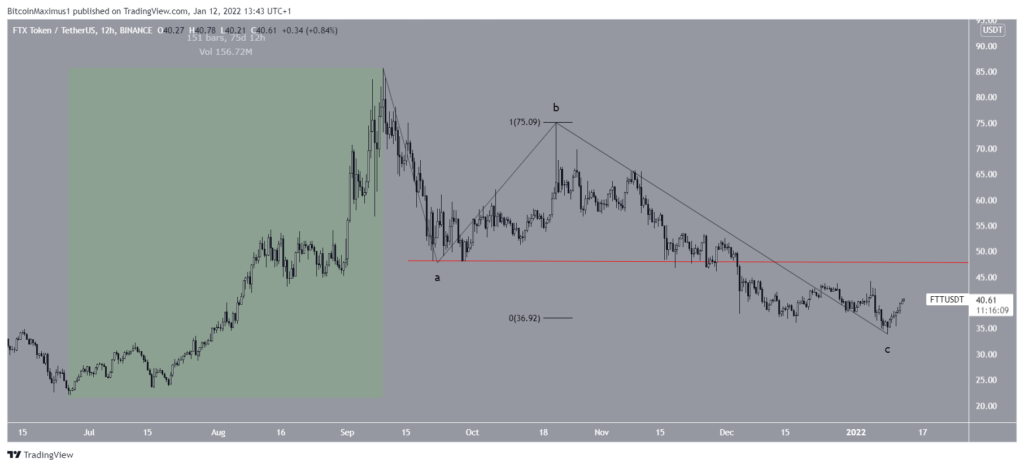
FTT wave count analysis
The decrease ensuing after the Sept 10 all-time high could be an A-B-C corrective structure. There are several reasons for this.
First, the previous uptrend (highlighted in green) resembles a bullish pattern, as it is a five-wave uptrend.
Secondly, waves A:C have an exactly 1:1 ratio, which is very common in such structures.
FTT needs to break above the September 21 lows at $47.8 in order to confirm this count. This would also lead to a break of the long-term descending resistance line.