After falling over $ 4,000 in a single day, the price of bitcoin is now facing a critical support level.
Technical Analysis
After failing to close a daily candle above $48K on January 4 (Tuesday), and following the global markets plunge, the BTC price dropped to $42.5K on Bitstamp.
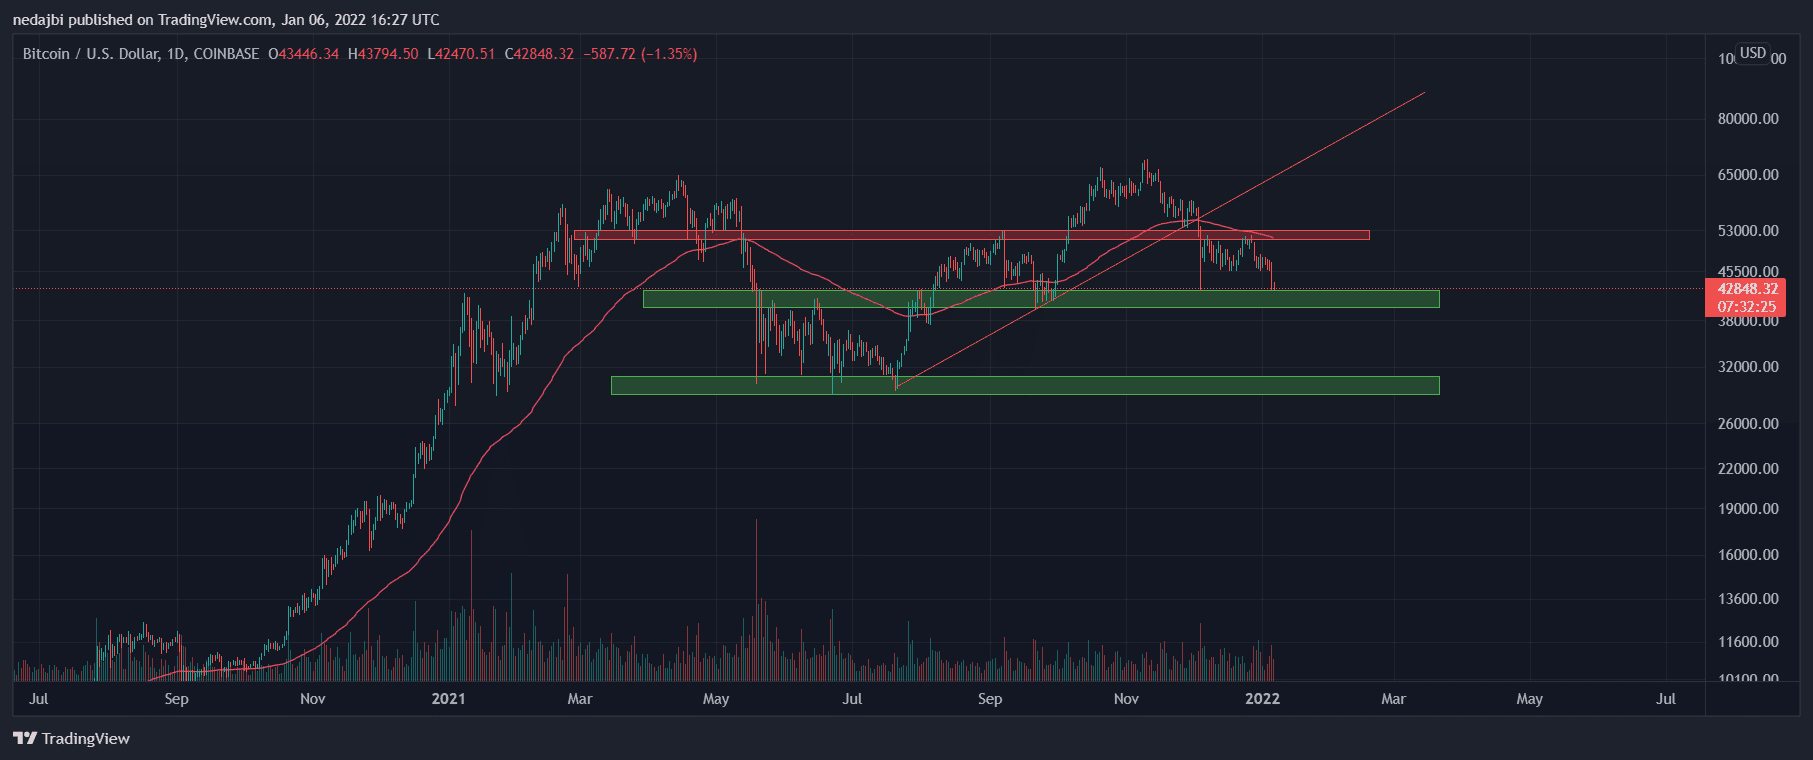
In the past few hours, bitcoin has traded between $ 42K and $ 43.5K. The $ 40-42K area has been a reliable support level in recent weeks, and so far BTC has maintained this range.
All in all, the low demand in the spot markets may set the stage for bitcoin to test lower prices, even in the form of wicks. A bearish signal popped after bitcoin lost the mid-term trendline and the 100-day EMA line (on December 3). Therefore, to regain confidence in a midterm recovery, bitcoin must first stabilize above the 100-day EMA line.
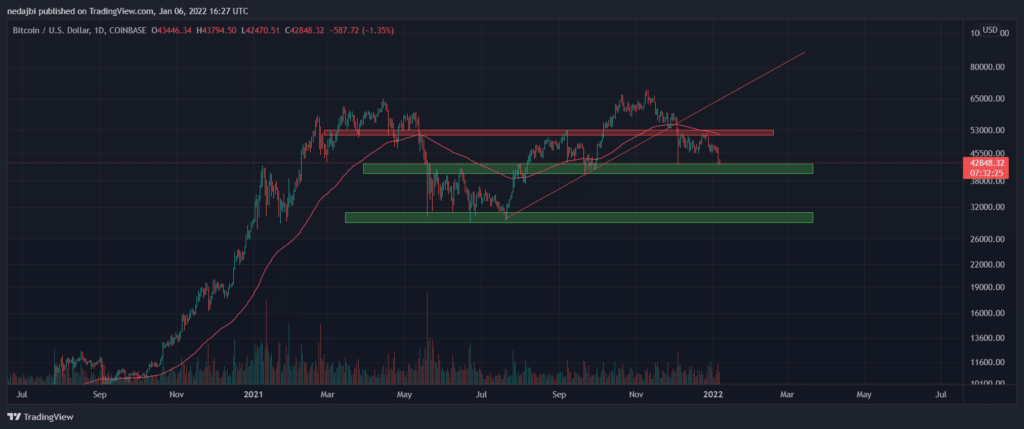
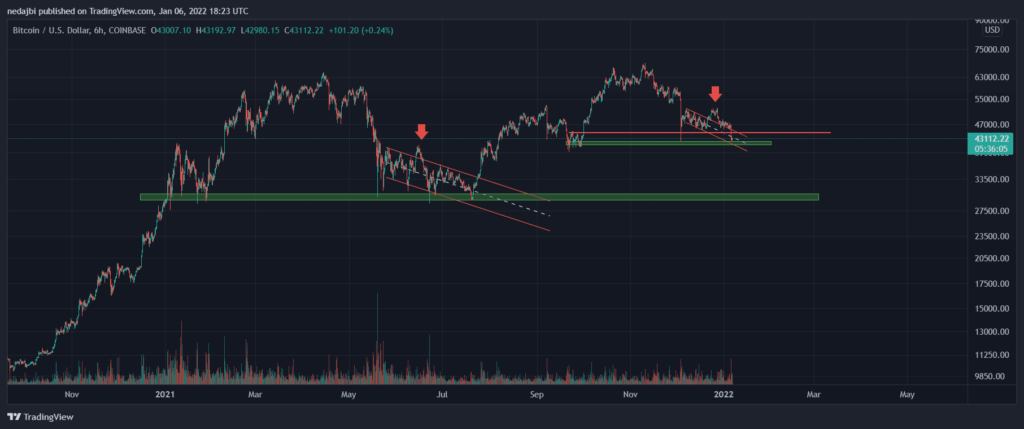
BTC has been trading in a descending channel since December. During the last week of 2021, bitcoin exited this channel but failed to stabilize above the $ 52,000 level and fell back inside the channel.
From a technical analyst’s point of view, this pattern is called a fake breakout. On the 6-hour time frame, a similar fake breakout took place through the May – July 2021 correction while the market was consolidating in the $29K-31K range.
Currently, bitcoin can target the upper channel line, which is at $ 45,000, and then if the selling pressure increases, the $ 40,000 to $ 42,000 area will likely be tested again.
Futures Market Analysis
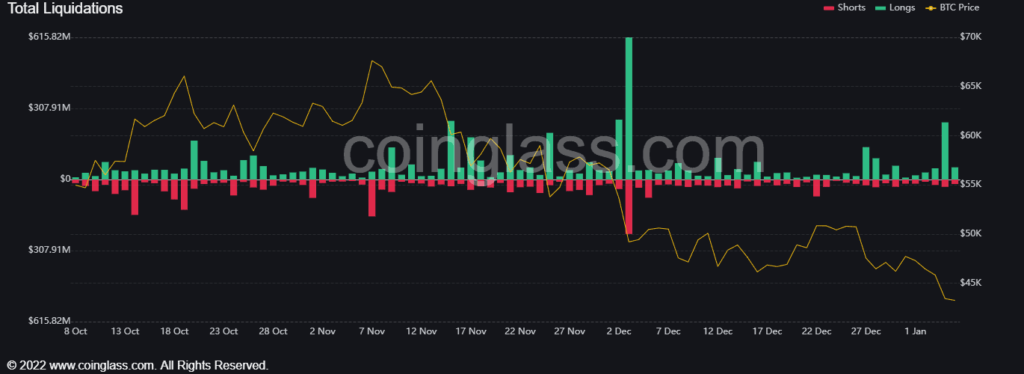
The price volatility on January 4 – 5 led to a liquidation event of approximately $300M and $50M of long and short contracts in the perpetual markets.
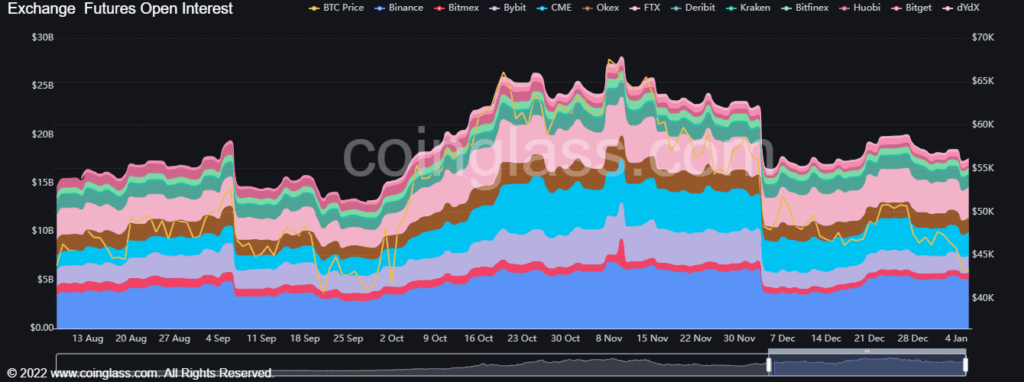
Interestingly, this substantial liquidation volume did not significantly reduce the open interest in the futures markets. Therefore, we can expect to see more volatility in the coming days.
